


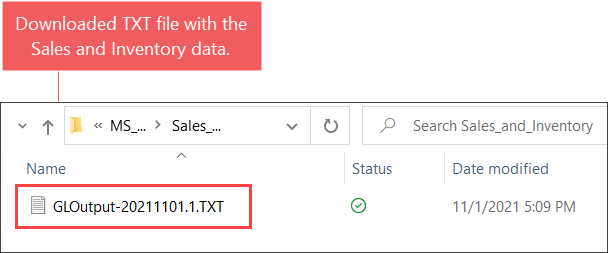
The exported TXT file with the Sales and Inventory data contains the information about sales, inventory, paidouts, and transfers.
Sales and Inventory File Name
The Sales and Inventory TXT file name has the following structure:
<GLOutput>-<YYYYMMDD>.<Num>.TXT
- GLOutput: Default file prefix, a fixed value.
- YYYYMMD: The date of the data export.
- Num: The sequential number of the exported file.
The example of the downloaded TXT file with the sales and inventory data is displayed in the image below:
Sales and Inventory File Data Structure
Sales and inventory data in the TXT file is grouped in columns. The description of each column is provided in the table below.
| Column name | Column description |
| Description |
Displays the name of the exported data type. Possible values:
|
| Date | The date of the data export. |
| AccountNo | The account number which is generated depending on the data type and the station general ledger number. |
| Debit, Credit | Total value. Each row in the file contains either Debit or Credit value. |
Sales Data Structure
The Sales data is taken from the Item Sales by Tags and Department Sales reports. For each day, the following rows are generated in case of the corresponding data exists:
- The first row contains the retail sales data:
- 5: A fixed default value.
- CategoryGL#: The general ledger number which is configured at the category level. For more information, see Adding a New Category.
- StationGL#: The general ledger number which is configured at the station level. For more information, Advanced Location Options.
- The second row contains the inventory losses data:
- 1: A fixed default value.
- CategoryGL#: The general ledger number which is configured at the category level. For more information, see Adding a New Category.
- StationGL#: The general ledger number which is configured at the station level. For more information, Advanced Location Options.
- The third row contains the increase in COGs:
- 6: A fixed default value.
- CategoryGL#: The general ledger number which is configured at the category level. For more information, see Adding a New Category.
- StationGL#: The general ledger number which is configured at the station level. For more information, Advanced Location Options.
| Column name | Column description |
| Description | Sales: Category (Category Name) |
| Date | The sales date. |
| AccountNo |
<5><CategoryGL#><StationGL#>: |
| Debit | 0.00 |
| Credit |
The Retail column value from the Item Sales by Tags report. The Non-itemized Sales column value from the Department Sales report. |
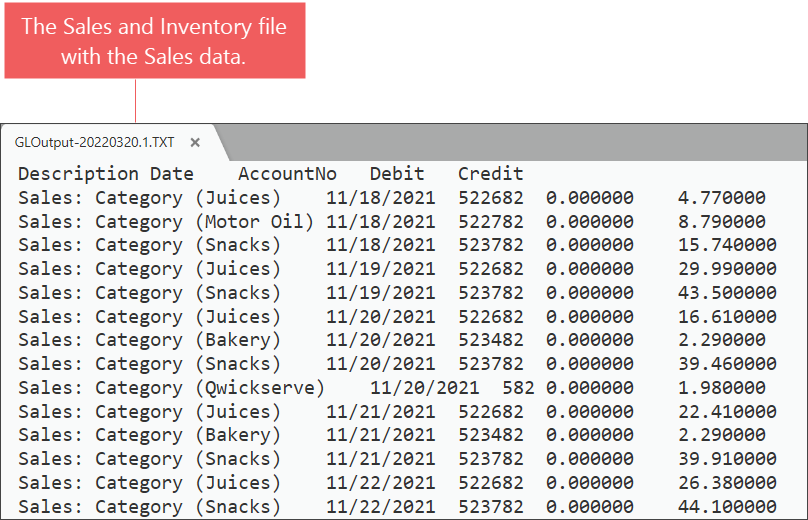
The example of the rows with the retail sales data is displayed in the image below:
| Column name | Column description |
| Description | Inventory: Category (Category Name) |
| Date | The sales date. |
| AccountNo |
<1><CategoryGL#><StationGL#>: |
| Debit | 0.00 |
| Credit | The Cost column value from the Item Sales by Tags report. |
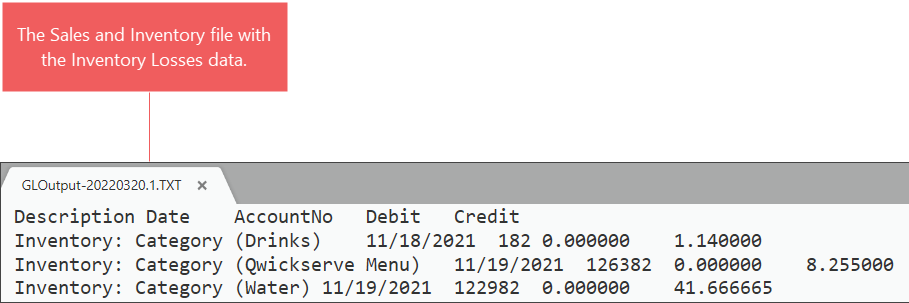
The example of the rows with the inventory losses data is displayed in the image below:
| Column name | Column description |
| Description | Department (COG) |
| Date | The sales date. |
| AccountNo |
<6><CategoryGL#><StationGL#>: |
| Debit | The Cost column value from the Item Sales by Tags report. |
| Credit | 0.00 |
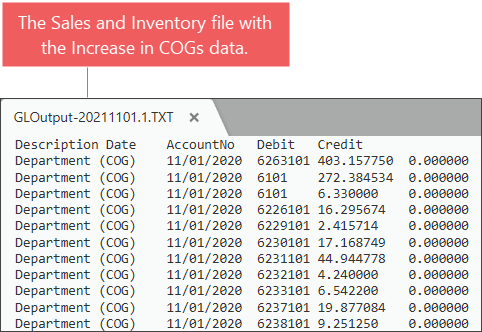
The example of the rows with the increase in COGs data is displayed in the image below:
For more information about working with the reports, see Item Sales by Tags report, see Item Sales by Tags and Department Sales reports.
Category Returns Data Structure
The Category Returns data is taken from the from the Department Sales section of the c) PLU Sales Report. At the same time, the category sales data is exported without deducting the refund amount.
| Column name | Column description |
| Description | Return: Category (Category Name) |
| Date | The return date. |
| AccountNo |
<1><CategoryGL#><StationGL#>:
|
| Debit | The Refunds > Value column's value from the Department Sales section of the c) PLU Sales Report. |
| Credit | 0.00 |
For more information about the Department Sales section of the shift report, see PLU Sales Report.
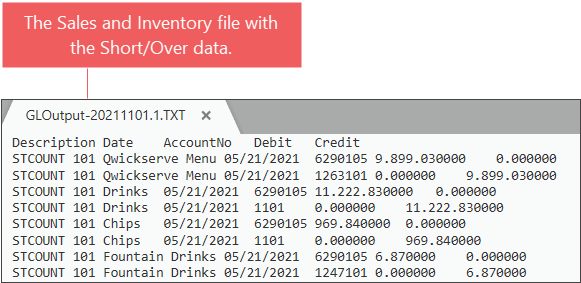
Short/Over Data Structure
The Short/Over data is taken from the Item Shortage report. This data is exported only if the inventory tickets were found within the selected report period. For each short by each category two rows for different account numbers are generated:
- The first row adds short data to the account:
- STCOUNT: Indicates that the Short/Over data is exported.
- StationGL#: The general ledger number which is configured at the station level. For more information, Advanced Location Options.
- CategoryName: The category name.
- The second row decreases the account's inventory:
- STCOUNT: Indicates that the Short/Over data is exported.
- StationGL#: The general ledger number which is configured at the station level. For more information, Advanced Location Options.
- CategoryName: The category name.
- 1: A fixed default value.
- CategoryGL#: The general ledger number which is configured at the category level. For more information, see Adding a New Category.
- StationGL#: The general ledger number which is configured at the station level. For more information, Advanced Location Options.
| Column name | Column description |
| Description | <STCOUNT> <StationGL#> <CategoryName>: |
| Date | The invoice ticket date. |
| AccountNo | 6290105 |
| Debit | The positive value of the short total. |
| Credit | The negative value of the short total. |
| Column name | Column description |
| Description | <STCOUNT> <StationGL#> <CategoryName>: |
| Date | The invoice ticket date. |
| AccountNo |
<1><CategoryGL#><StationGL#>: |
| Debit | The positive value of the short total. |
| Credit | The negative value of the short total. |
The example of the rows with the short/over data is displayed in the image below:
For more information about working with the Item Shortage report, see Item Shortage report.
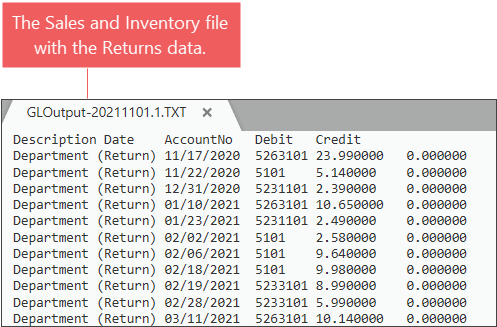
Department Returns Data Structure
The Department Returns data is taken from the Itemized Refunds report which data is grouped by categories and days. For each return a separate row is generated with the following data:
| Column name | Column description |
| Description | Department (Return) |
| Date | The return date. |
| AccountNo |
<5><CategoryGL#><StationGL#>:
|
| Debit | The return total. |
| Credit | 0.00 |
The example of the rows with the returns data is displayed in the image below:
For more information about working with the Itemized Refunds report, see Itemized Refunds report.
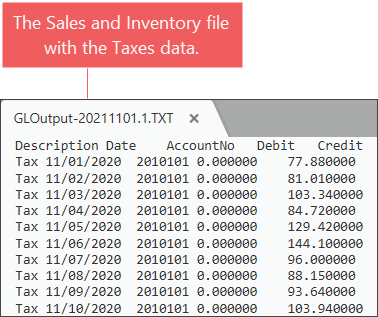
Taxes Data Structure
The Taxes data is taken from the Consolidated Tax Sales report which data is grouped by days and exported in the row with the following data:
| Column name | Column description |
| Description | Tax |
| Date | The tax date. |
| AccountNo |
<2010><StationGL#>:
|
| Debit | 0.00 |
| Credit | The daily tax total. |
The example of the rows with the taxes data is displayed in the image below:
For more information about working with the Consolidated Tax Sales report, see Consolidated Tax Sales report.
Paid In Data Structure
The Paid in data is taken from the Day column of the cash reconciliation Daily Data form.
| Column name | Column description |
| Description | Cash Paid In |
| Date | The paid in date. |
| AccountNo |
<2005><StationGL#>:
|
| Debit | The sum of paid in within one day from the Day column. |
| Credit | 0.00 |
For more information in how to work with the Daily Data form, see Daily Data.
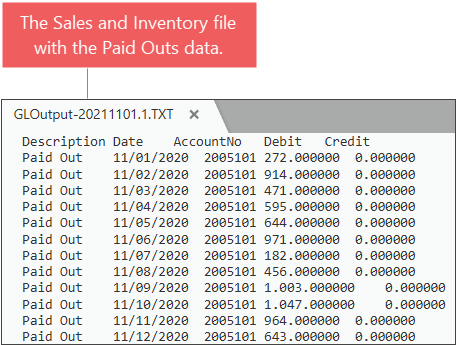
Paid Out Data Structure
The Paid out data is taken from Tickets Paid Outs field on the Lottery Count form. For each sum within one day, a separate row is generated with the following data:
| Column name | Column description |
| Description | Paid Out |
| Date | The paid out date. |
| AccountNo |
<200><StationGL#>:
|
| Debit | The sum of paid outs within one day. |
| Credit | 0.00 |
The example of the rows with the paid outs data is displayed in the image below:
For more information about working with the Lottery Count form, see Lottery Count.
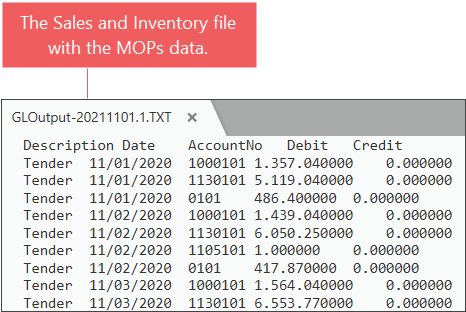
MOPs Data Structure
The MOPs data is taken from the Cash Reconciliation report. For each MOP, a separate row is generated with the following data:
| Column name | Column description |
| Description | Tender |
| Date | Date |
| AccountNo |
<MOPAccountNo><StationGL#>:
|
| Debit | The MOP's total for the day. |
| Credit | 0.00 |
The example of the rows with the MOPs data is displayed in the image below:
For more information about working with the Cash Reconciliation report, see Cash Reconciliation report.
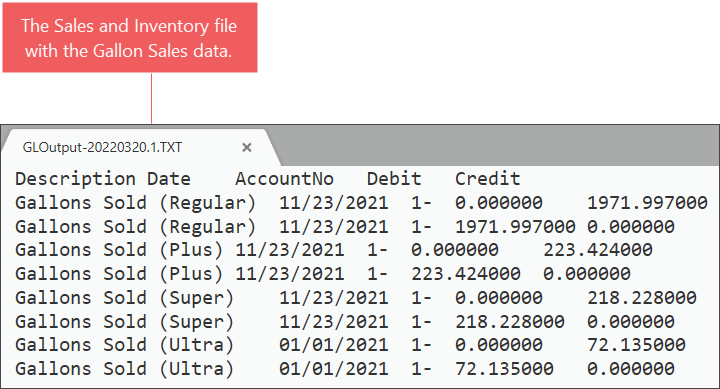
Gallons Sales Data Structure
The Gallons Sales data is taken from the Sales Summary report > Volume column. Sales data is reported in two rows: credit and debit. For each Gallons Sold data, a separate row is generated with the following data:
| Column name | Column description |
| Description | Gallons Sold |
| Date | The date for which the gallons sales data is reported. |
| AccountNo |
<{LocationGL2} - {FuelProductGL#}>:
|
| Debit | |
| Credit |
The example of the rows with the gallons sals data is displayed in the image below:
For more information, see Connecting to MAS90 and Sales Summary report.
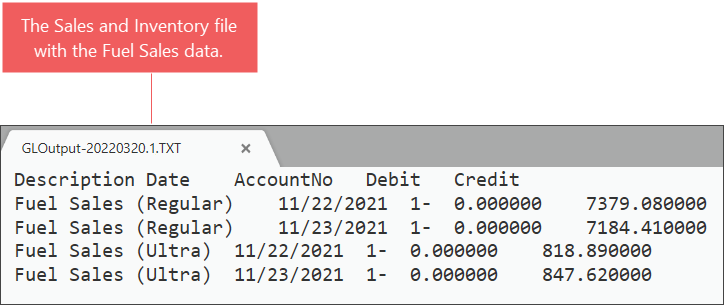
Fuel Sales Data Structure
The Fuel Sales data is taken from the Sales Summary report > Sales column. Sales data is reported in two rows: credit and debit. Each row is generated with the following data:
| Column name | Column description |
| Description | Fuel Sales |
| Date | The date for which the fuel sales data is reported. |
| AccountNo |
<{LocationGL2} - {FuelProductGL#}>:
Fuel Sales data is exported, if any, regardless of whether the GL# is configured for the fuel product or not. |
| Debit | |
| Credit |
The example of the rows with the fuel sales data is displayed in the image below:
For more information, see Connecting to MAS90 and Sales Summary report.


