


This section describes the specifics of accessing and interpreting the Sales Summary report.
Opening the Report
You can find the report at Reports > Accounting > Review Sales > Sales Summary.
The Sales Summary report can be opened at all levels:
- Account
- Company
- Division
- Location (Station)
For more information, see Viewing Reports.
Sales summary—How to access
This video presents the information on how to access Sales Summary report.
Viewing the Report
The Sales Summary report is a combination of several reports providing the detailed summarized sales information for all the departments. This report shows all fuel sales, store sales, paid outs that were pulled via the shift report that came directly from the cash register.
In contrast to the Cash Register Journal report, the Sales Summary report contains the information only from the shift while the Cash Register Journal report, which is intended to view the individual transaction's data mostly, contains voids and other non-sale data.
The report contains the following sub-sections:
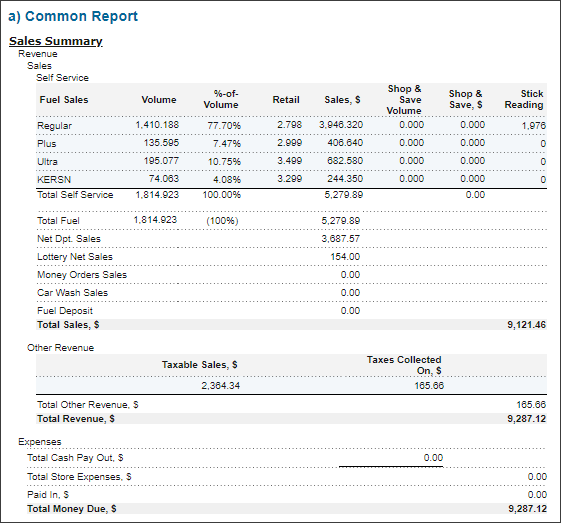
- Common Report
- Sales Summary

- Other Revenue:
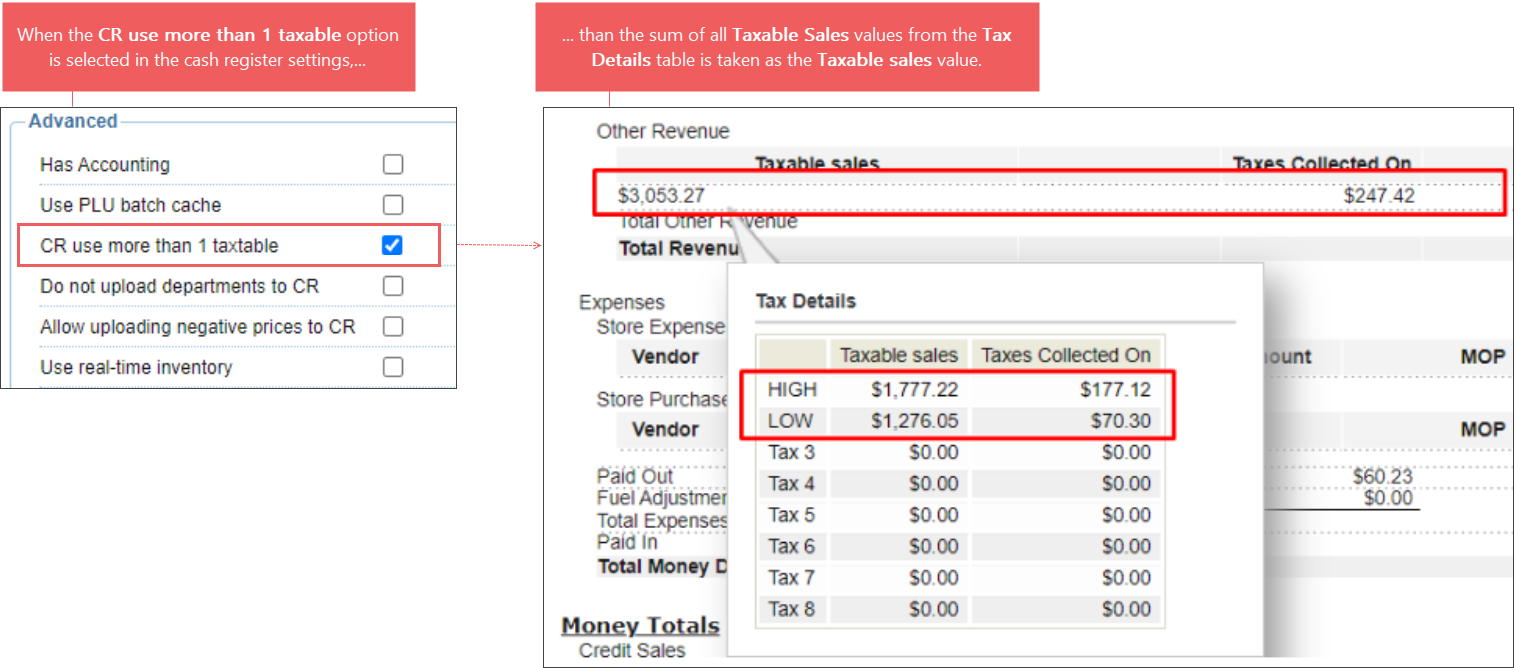
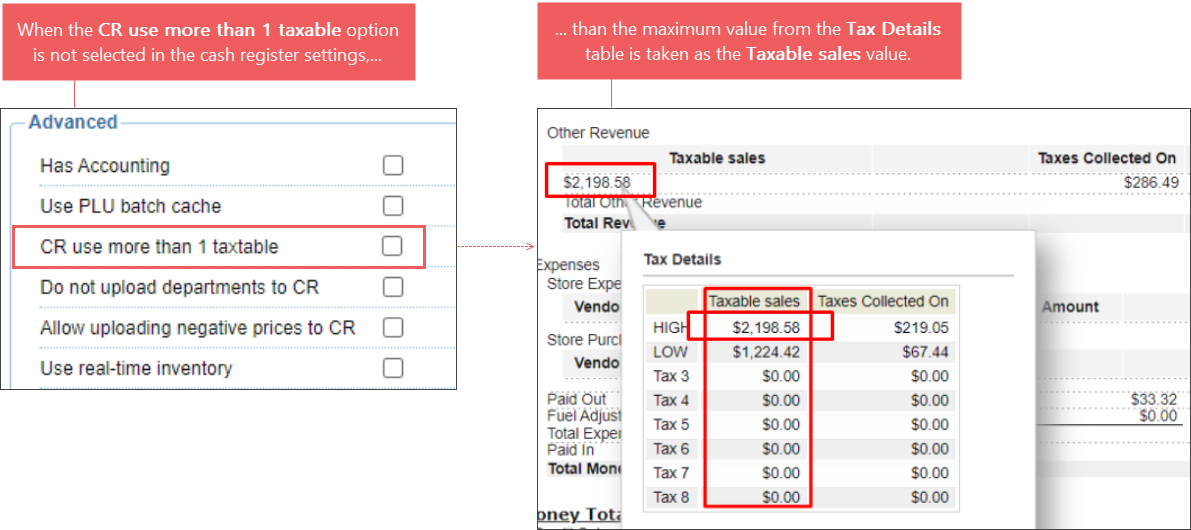
- Taxable sales: Hover over the Taxable sales value, to view more details in the Tax Details table. This value is calculated based on the cash register settings in CStoreOffice®:
- If the CR use more than 1 taxable option in the CR settings is selected, the Taxable sales value is equal to the sum of all Taxable Sales values from the Tax Details table.
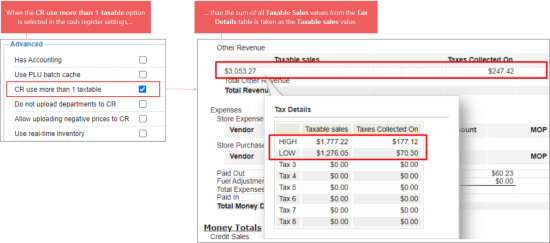
- If the CR use more than 1 taxable option in the CR settings is not selected, the Taxable sales value is equal to the maximum Taxable Sales value from the Tax Details table.

For more information on how to configure the CR use more than 1 taxable option, see Advanced Settings.
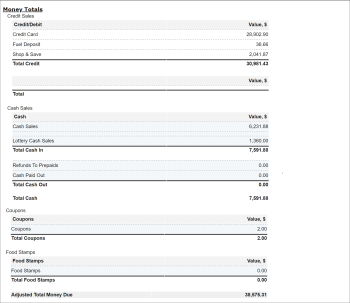
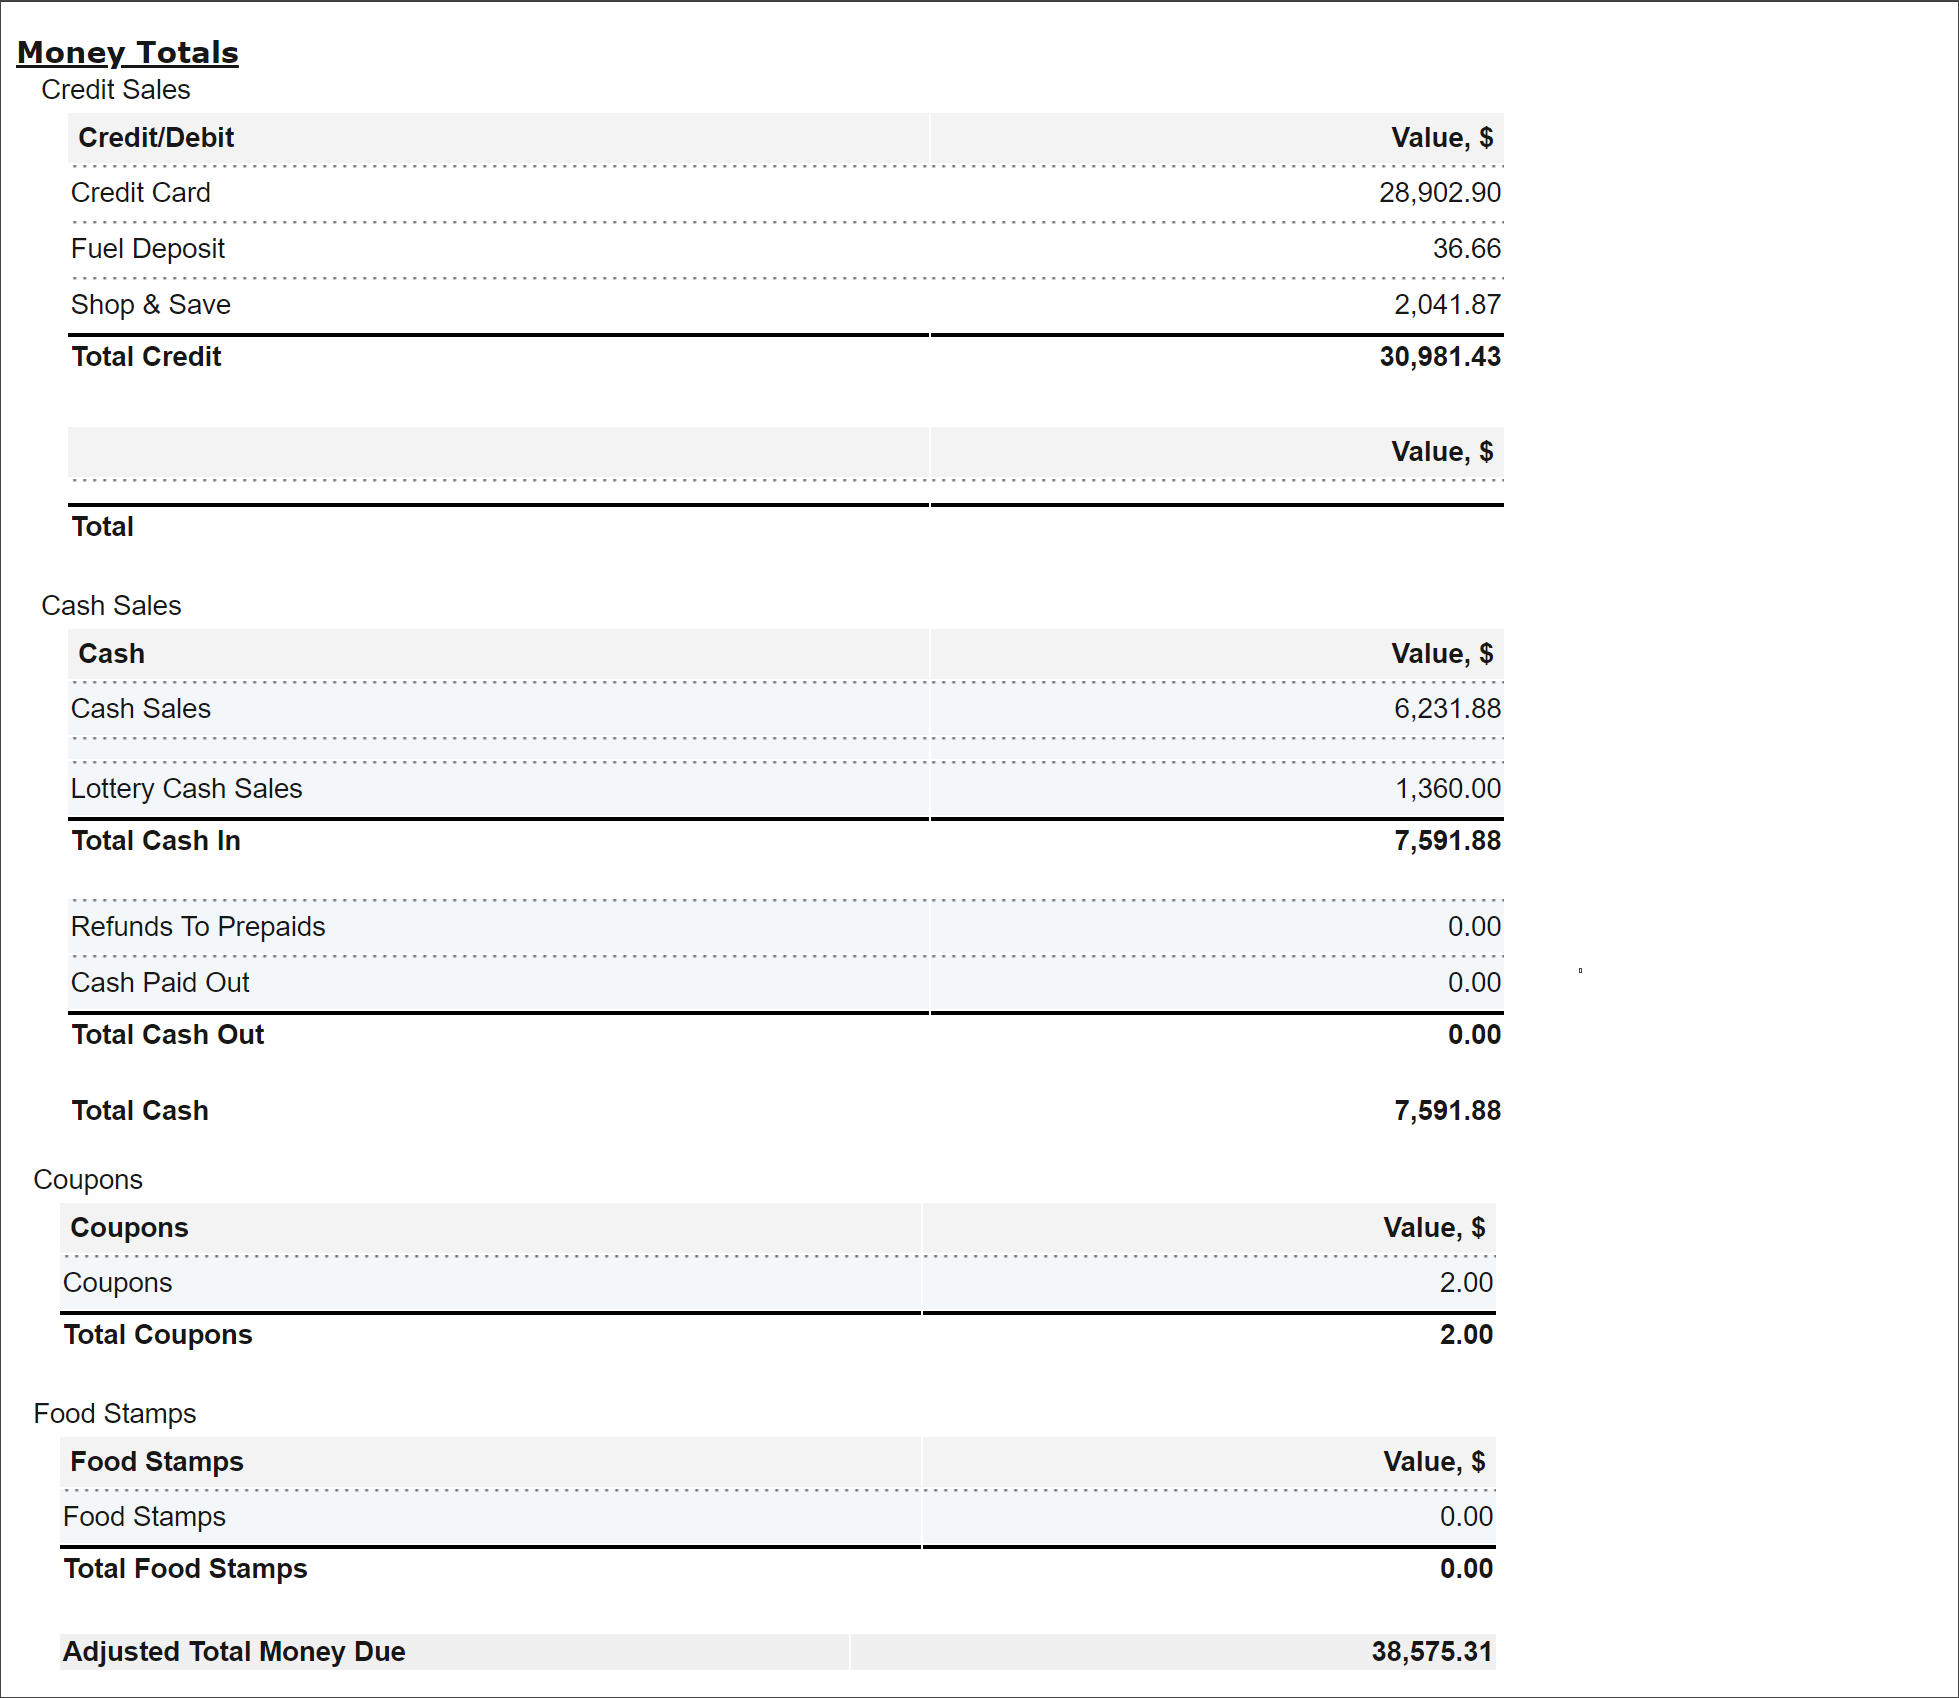
- The Total Money Due is calculated in different ways depending on the Use Paidout Control System option in the MISC station options:
- If the Use Paidout Control System option is enabled, the Total Money Due is calculated by the following formula:
Total Money Due = Total Revenue + Paid In. - If the Use Paidout Control System option is disabled, the Total Money Due is calculated by the following formula:
Total Money Due = Total Revenue + Paid In - Paid Out.
For details, see MISC > Station Options.
- Money Totals
- NRGT

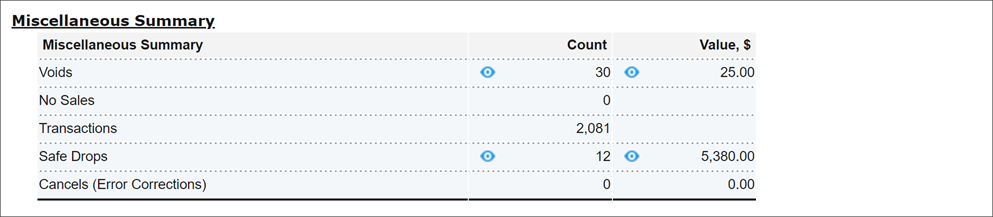
- Miscellaneous Summary
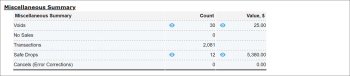
Voids, no sale and safe drop event details can be viewed within the About Loss Prevention Analytics product.
- PLU Sales Report
- Department Sales
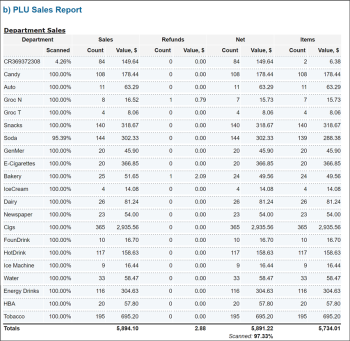
- Department
Scanned value is calculated by the following formula: Scanned = 100 x (Item Sales Amount - Item Sales Refund) / (Department Sales Amount - Department Sales Refund).
If the CR Department with the Lottery Instant Paidouts type has the Scanned value = 0%, make sure the Allow Direct Sales and Is Negative options are selected in the department setup form. For details, see CR Departments.
The Scanned Total value is calculated by the following formula: Scanned Total = 100 x (Total Item Sales Amount - Total Item Sales Refund) / (Total Department Sales Amount - Total Department Sales Refund). - Gross Sales: Calculated as the sum of Net Sales, Discounts, and Refunds.
- Discounts: The total value of all discounts, including regular discounts and promotional discounts.
- Refunds: The total sum of refunds.
- Net Sales: The final amount received for the department, net of all discounts, promotions, and refunds.
- Items: The items sold during the shift.
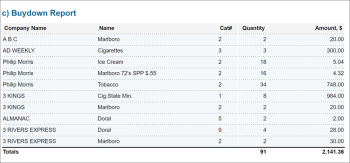
- Buydowns Report
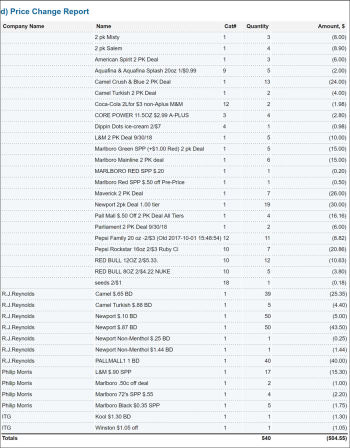
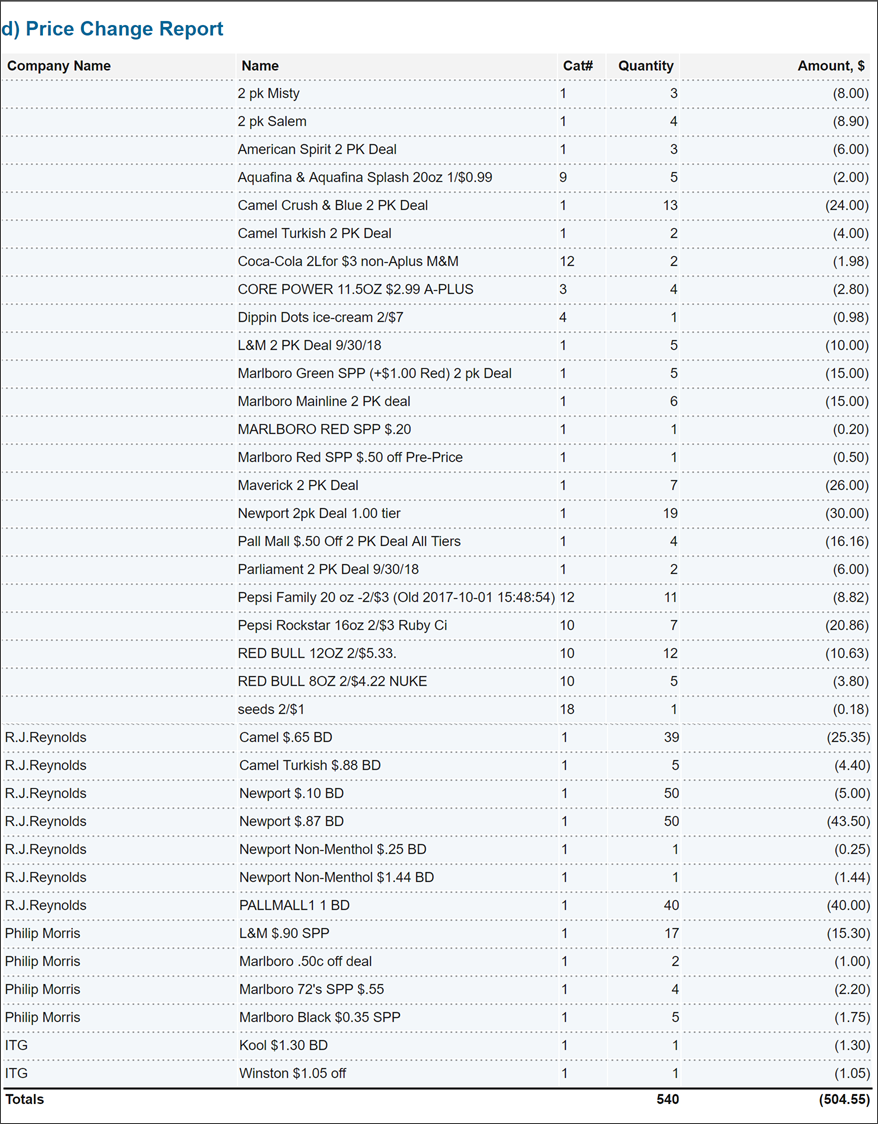
- Price Change Report


Filtering and Sorting the Report Data
To get the exact information you need, you can apply filters to the report. To set up a filter, select one or more filtering options. Once the filter is set up, at the bottom of the filter section, click the Refresh button to display the report data by the filter criteria.
The report provides the following filtering options:
- Date: Specify the period you are interested in manually using the calendar or use one of the available filtering options, and then click Refresh There are the following filtering periods available:
- Custom Date. Select this filtering option and specify the period you are interested in using the calendar.
- Yesterday
- Current Month
- Current Quarter
- Current Year
- Last Month
- Last Quarter
- Last Year
- Last 12 Months
- Station Included: Select the stations you want to view the report for.
- Filter by Cash Registers: Select the cash registers by which you want to filter the report data. This filter is displayed only if the Enable Multi CR Sales Processing option is selected in the cash register settings. For more information, see Multi Cash Register Support.
- Filter by Shift: Select this option to filter the report results by shift.
For more information on additional report features, see Reports.


