


The PLU Sales Report provides sales details for the shift broken down by departments (Department sales sub-section) and by other criteria, such as margin, category, or new items (Detailed sub-section). The information is divided into the following sub-sections:
Ensure all items are included and configured in the price book to improve scan rates.
Department Sales
To drill down into a specific department's sales for a the shift:
- Click anywhere in the row for the department.
- Then click Items or PLU, to expand the list of actual items sold during the shift.
In case Undefined department is displayed for some items, make sure the items' departments configured at the cash register and in CStoreOffice® coincide. For more information, see FAQs: Shifts.
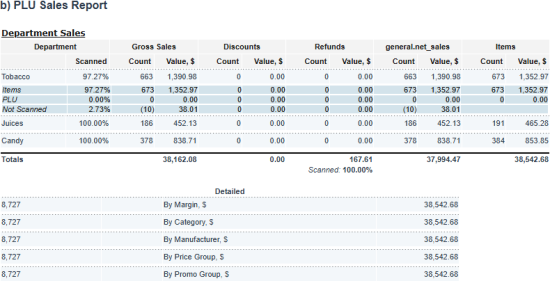
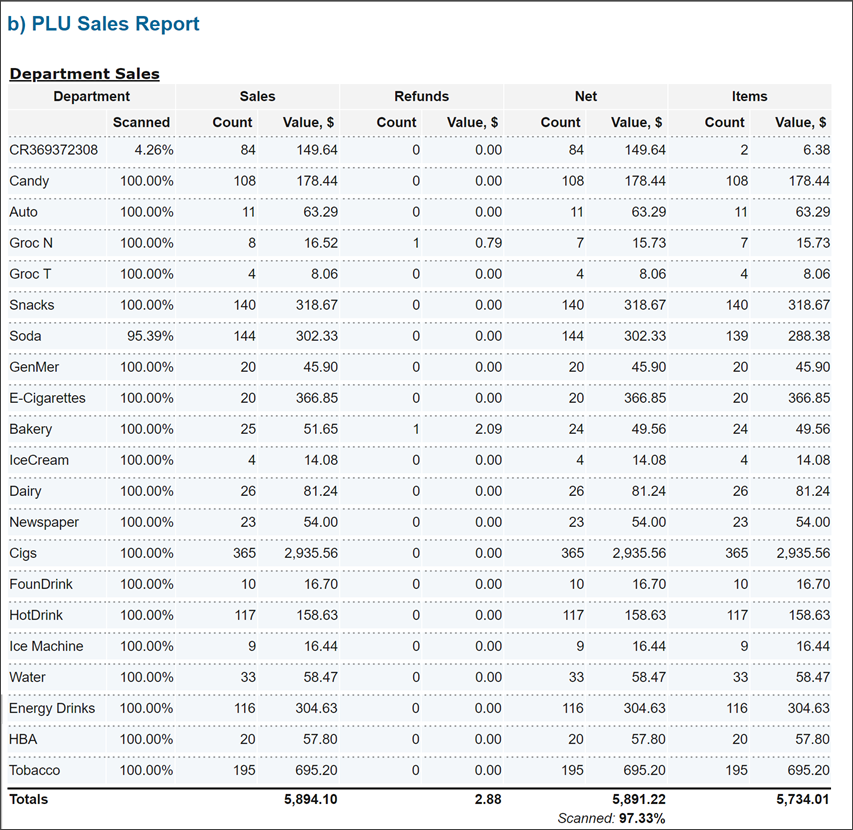
In the Department Sales table, the following information is displayed:
- Department: This column includes the following data:
- Department name
- Scanned: This value is calculated by the following formula: Scanned = 100 x (Item Sales Amount - Item Sales Refund) / (Department Sales Amount - Department Sales Refund).
If the CR Department with the Lottery Instant Paidouts type has the Scanned value = 0%, make sure the Allow Direct Sales and Is Negative options are selected in the department setup form. For details, see CR Departments.
The Scanned Total value is calculated by the following formula: Scanned Total = 100 x (Total Item Sales Amount - Total Item Sales Refund) / (Total Department Sales Amount - Total Department Sales Refund). - Gross Sales: Calculated as the sum of Net Sales, Discounts, and Refunds.
- Count
- Value
- Discounts: The total value of all discounts, including regular discounts and promotional discounts. This column includes the following data:
- Count
- Value
- Refunds: The total sum of refunds. This column includes the following data:
- Count
- Value
- Net Sales: The final amount received for the department, net of all discounts, promotions, and refunds. This column includes the following data:
- Count
- Value
- Items: This column includes the following data:
- Count
- Value
- Profit
- GPM: This value is displayed for the items sold during the shift and calculated by the following formula: GPM = (Current Retail - Cost) / Current Retail. Mind that as the cost value, CStoreOffice® uses one of the following values (starting from the highest priority): Actual Cost > Promotional Cost > Negotiated Cost.
The eye icon displayed at the bottom of the refunds column leads to the Loss Prevention Analytics product and provides more detailed information on refunds. For more information, see Loss Prevention Analytics.
The information about the percentage of items scanned, entered as a PLU, or not identified is useful to make sure you are getting as close to 100% scanning as possible, especially for departments like cigarettes and tobacco.
Sometimes you may experience the issue when the QwickServe orders are displayed instead of sold items in the Items row for the QwickServe department. It may happen when the shift was accepted before the QwickServe orders were loaded into CStoreOffice®. For more information on how troubleshoot it, see FAQs: QwickServe > Reports.
Itemized Refunds
To enter the refunds for the items, if any, click the Itemized Refunds button. For details, see Entering Itemized Refunds.
Detailed
To drill down into the sales details by margin, category, or another criteria:
- Click anywhere in the row for the criteria you need.
- To expand the list of actual items grouped by the criteria you selected, click Items or PLU.
When you have drilled down to a specific item, if you want more information about it, click the green information icon  next to the item. Graphs are opened in a new window providing you with detailed information about cost, retail, sales, and margin for that item over the last month (or another period at your choice). You can use these logs to quickly identify issues that might come up, such as pricing or stocking issues.
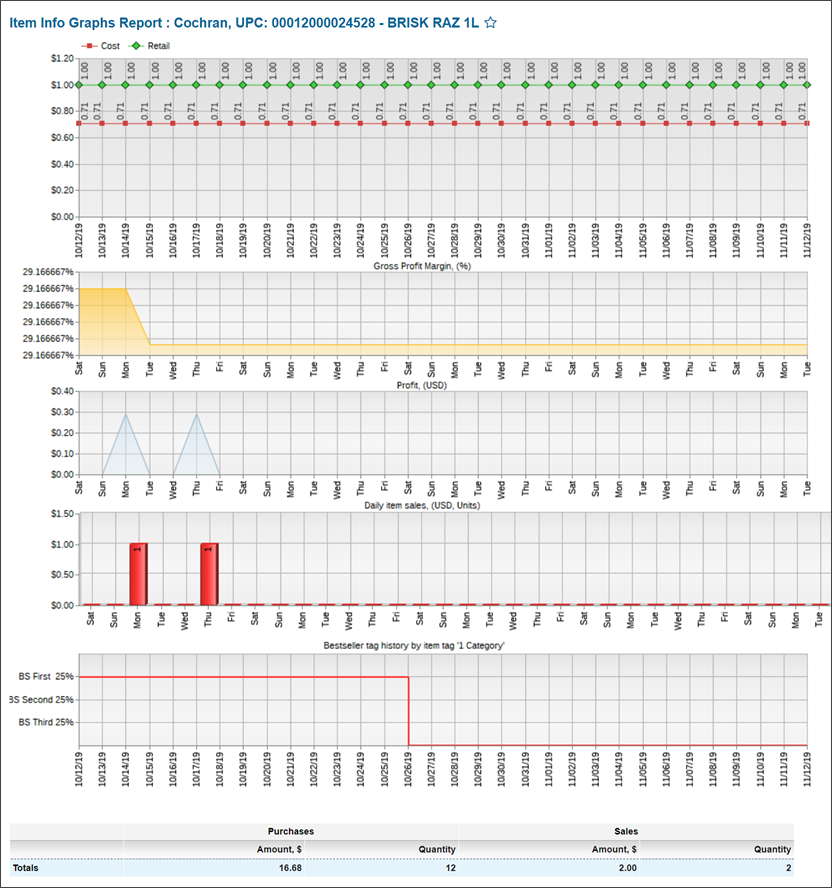
- The first graph shows a visualized comparison of retail and cost
- The second graph shows the Gross profit margin of the item over the selected period.
Notice how the GPM decreases when the cost of the item goes up but the retail stays the same. Using this graph you can quickly identify when a change in the supplier’s price is causing you to lose money.
- The third graph shows profit in dollars.
- The forth graph shows the daily item sales in dollars. If suddenly there are no sales on an item that normally sells well, it might indicate that the item is out of stock.
- The fifth graph shows which Best Seller groups the item belonged to over the selected period, in other words, it shows how high its sales were compared to other items. The item sales are compared and sorted, and the items are divided into groups: the first group includes best selling items that together make 25% of total sales, the second group includes next items in the list that make another 25% of total sales, the third group —next 25%, and finally there items that are not included into Best Sellers at all.


