


This section describes the specifics of accessing and interpreting the Fuel Projection report.
Opening the Report
You can find the report at Reports > Fuel > Sales > Fuel Projection.
The Fuel Projection report can be opened at all levels:
- Account
- Company
- Division
- Location (Station)
For more information, see Viewing Reports.
Viewing the Report
The Fuel Projection report allows you to review fuel sales statistics and estimate the projection for future fuel sales. The report projections are based on the real fuel sales coming from the shifts.
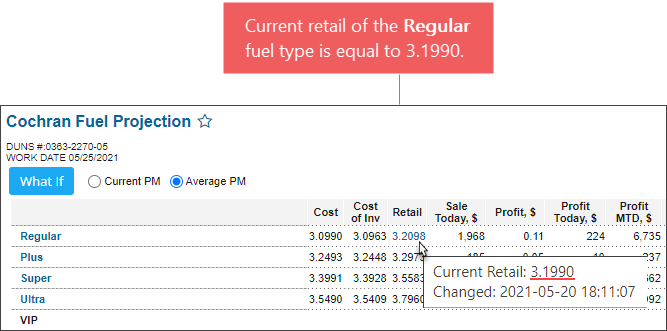
Current fuel retail is not considered in the projection calculations. However, you can always get it in the report by hovering over the Retail column's value for the fuel type you need.
The statistics is provided for all fuel types configured at the location. For details, see Mix & Fuels Settings.
The amount of the fuel sales for each fuel type and also retail and margin values, if any, are calculated considering the taxes configured for the fuel types at the state, county, and municipality levels.
If the taxes are not configured, they are not deducted from the fuel sales values.
To check the fuel type taxes configured at the state, county, and municipality levels:
- Go to Settings > General > Setup Taxation.
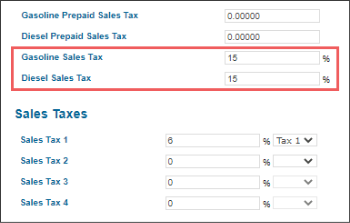
- Check the fuel taxes configured at the state level:
- In the Taxation Setup form, go to the State section > Gasoline Taxes subsection.
- At the end of the Gasoline Taxes section, check the following values:
- Gasoline Sales Tax: The value of the gasoline sales tax that is configured for the location at the state level.
- Diesel Sales Tax: The value of the diesel sales tax that is configured for the location at the state level.
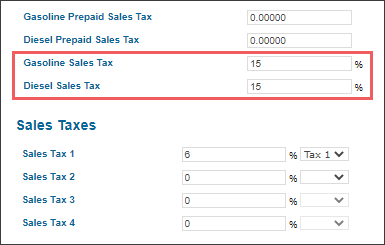
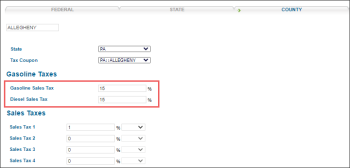
- Check the fuel taxes configured at the county level:
- In the Taxation Setup form, go to the County section > Gasoline Taxes subsection.
- In the Gasoline Taxes subsection, check the following values:
- Gasoline Sales Tax: The value of the gasoline sales tax that is configured for the location at the county level.
- Diesel Sales Tax: The value of the diesel sales tax that is configured for the location at the county level.

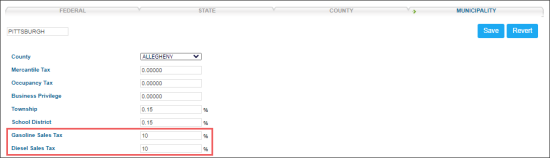
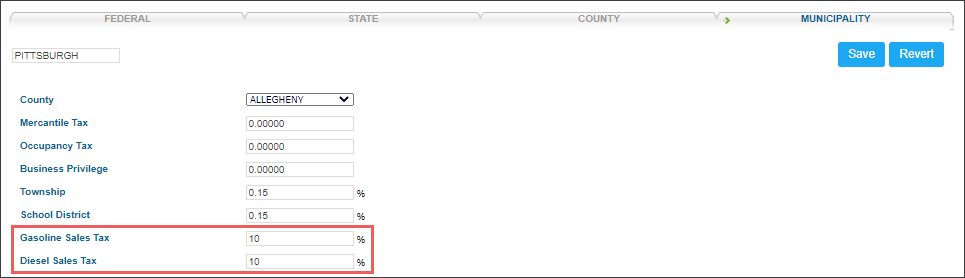
- Check the fuel taxes configured at the municipality level:
- In the Taxation Setup form, go to the Municipality section.
- In the Municipality section, check the following values:
- Gasoline Sales Tax: The value of the gasoline sales tax that is configured for the location at the municipality level.
- Diesel Sales Tax: The value of the diesel sales tax that is configured for the location at the municipality level.
For more information on how to configure taxes for the fuel types, see Taxation Setup.
Cost of Inventory Calculation Modes
The fuel statistics in the report may differ depending on the Cost of Inventory calculation mode set for the location. CStoreOffice® can calculate the fuel statistics in the following modes:
- Average calculation mode: In this calculation mode, the fuel statistics is calculated as average values.
- First In - First Out calculation mode: In this calculation mode, the whole volume of fuel in the tank is considered 'layered', that is, belonging to different purchases at different costs. The fuel from the next 'level' does not start selling before the whole fuel volume from the previous 'level' is sold.
In this mode, CStoreOffice® calculates the fuel statistics by fuel purchases (layers) and corresponding fuel costs. The FIFO calculation mode affects those report values that are calculated using the Cost of Inventory value, including:
- Cost of Inventory
- Profit. For a commission agent station, this column contains the commission value.
- Profit Today
For details on how to switch between the Cost of Inventory calculation modes, see MISC > Station Options.
Prerequisites
Before you run the report, make sure you have correctly entered the following fuel data in CStoreOffice®:
- Fuel purchases: Vendors > Bills > Fuel Invoices > Gross Gallons Delivered and Net Cost Per Gallon)
- Fuel sales: Data Entry > Fuel Sales > Gallons Sold today
- Level of fuel in the tank: Data Entry > Fuel Inventory > Today's ending stick reading
Running the Report
To run the Fuel Projection report:
- At the top of the report form, select the date for which you want to create the projection report. By default, the report is created for the last fuel sales date.
- Click Refresh.
- Select the data mode for the report: Current PM or Average PM. When you switch between the calculation modes, the report page is reloaded automatically.
You can now review the fuel sales statistics and projection data:
- General report statistics
- Possible Purchases
- Last Update
- Cash Register Status
- Links to Setup
- Pending Invoices
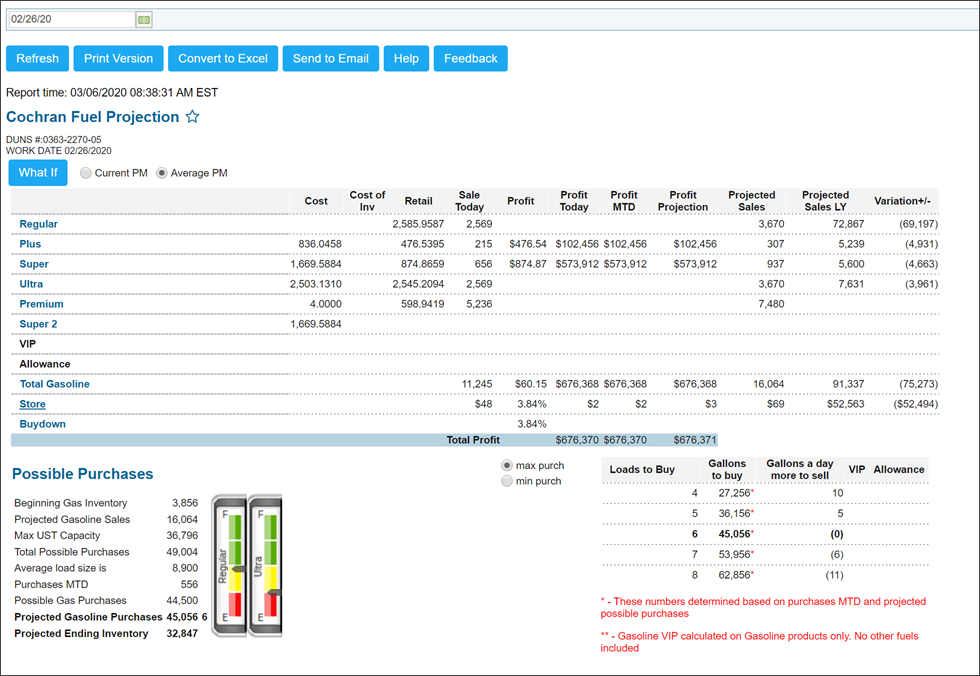
General Report Statistics
The general report statistics is dedicated to fuel purchases and sales broken down by fuel grade. You can analyze the following report data:
- Cost: The fuel cost taken from the latest invoice including taxes. Click the cost value to see the list of invoices for fuel grades.
- Cost of Inv: The cost of fuel in the tank.
In the average calculation mode, the Cost of Inventory value is calculated as the average cost of the fuel product in the tank by the following formula:
Cost of Inventory = (Open Inventory * Cost of Inv for the Previous Day + Purchase Amount * Cost per Gallon in the Purchase Invoice)/(Open Inventory + Purchase Amount)
In the FIFO calculation mode, the Cost of Inventory value is calculated taking into consideration different fuel purchases (layers) available in the tank as of the report date, and the cost per gallon for these layers. The Cost of Inventory value is calculated by the following formula:
Cost of Inventory = (Purchase Amount Layer 1* Cost per Gallon in Invoice 1) + (Purchase Amount Layer N* Cost per Gallon in Invoice N)/(Total Amount of Fuel in Tank)
- Retail: The fuel retail price which is taken from the shifts. Click the retail value to see the history of retail changes. The fuel retail price is calculated by the following formula:
Retail = (Amount of Fuel Sold - Taxes)/Volume of Fuel Sold
- Sale Today: The volume of fuel sold today.
- Profit: The profit amount. In the average calculation mode, the Profit value is calculated by the following formula:
Profit = Retail - Cost of Inventory
In the FIFO calculation mode, CStoreOffice® determines from which fuel layers the fuel is sold and calculates the profit based on these values. The Profit value is calculated by the following formula:
Profit = (Purchase Amount Layer 1* (Retail - Cost per Gallon in Invoice 1) + Purchase Amount Layer N * (Retail - Cost per Gallon in Invoice N))/(Total Volume of Fuel Sold)
- Profit Today: The profit for today calculated by the following formula:
Profit Today = Sale Today x Profit
- Profit MTD: The profit sum amount starting from the beginning of the month up to the current date.
- Profit Projection: The projected profit for the fuel product in the current month.
- Projected Sales: The projected sales for the fuel product in the current month. Click the projected sales value to view the Fuel Sales Detailed report.
- Projected Sales LY: The projected sales for the fuel product in the current month. This value is calculated taking into consideration information about fuel sales of the same period in the last year. Click the projected sales LY value to view the Fuel Sales History report.
- Variation +/-: A value showing the sales trends in the current month calculated by the following formula:
Variation +/-: Projected Sales - Projected Sales LY
Possible Purchases
The Possible Purchases section provides projections on how much fuel you need to purchase based on purchases MTD and projected possible purchases. To see the minimum and maximum purchase projection levels, select the max purch or min purch option.
You can view the following values:
- Beginning Gas Inventory
- Projected Gasoline Sales: Click the link or value to see the Fuel Sales Detailed report.
- Max UST Capacity: Click the link or value to go to the UST system settings for the location.
- Total Possible Purchases: The total possible purchases value calculated by the following formula:
Total Possible Purchases = Projected Gasoline Sales + Max UST Capacity - Beginning Gas Inventory
Click the link or value to see the Fuel Products Purchases report.
- Average load size is: Click the link or value to go to the UST system settings for the location.
- Purchases MTD: Click the link or value to see the Fuel Products Purchases report.
- Possible Gas Purchases: Click the link or value to open the Order Gasoline report.
- Projected Gasoline Purchases: Click the link or value to open the Order Gasoline report.
- Projected Ending Inventory: Click the link or value to open SIR reports for all fuel grades.
Last Update
In the Last Update section, you can see when fuel data was updated last.

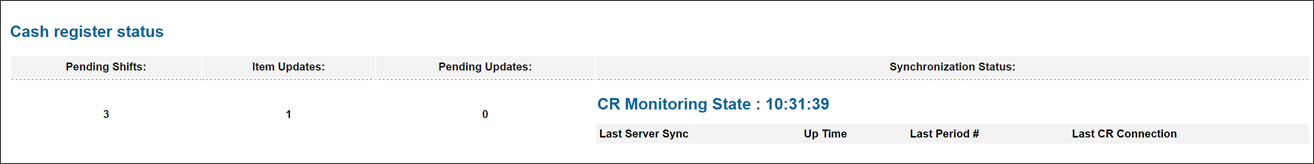
Cash Register Status
In the Cash register status section, you can see the current status of the cash register at the location. Click the value in the Pending Shifts or Item Updates columns to see the list of pending shifts or accepted PLU batch updates.
Links to Setup
In the Links to Setup section, you can see the list of links navigating to the location setup forms. Click the necessary link to configure the location settings.

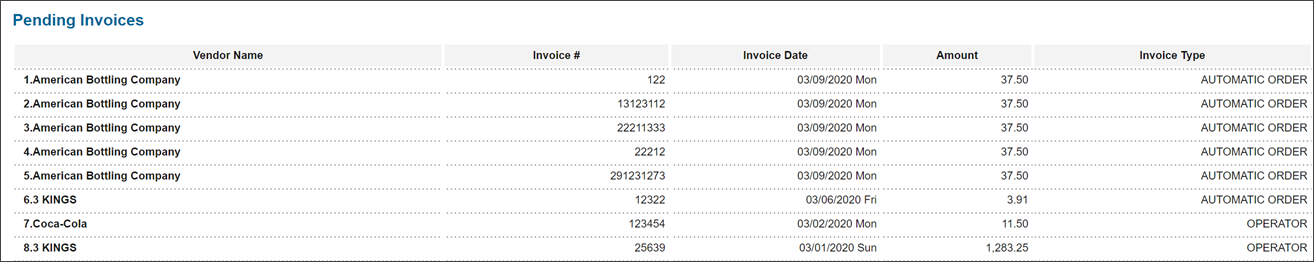
Pending Invoices
In the Pending Invoices section, you can see the list of pending invoices for the location. Click the necessary line to open the Pending Invoices report and go to the corresponding invoice data.
Additional Actions
You can perform the following activities with the Fuel Projection report:
- To get a print version of the report, at the top of the report form, click Print Version.
- To convert the report to an Excel file, at the top of the report form, click Convert to Excel.
- To send a report by email, at the top of the report form, click Send to Email. In the displayed window, in the To field, specify the email address to which you want to send the email message with the report and click Send.
- To open a section with the report description in the Petrosoft University Portal, at the top of the report, click Help.
- In case you have any questions or problems, you can create a new ticket about the report directly from the report form. To do this, at the top of the report form, click Feedback, then fill the ticket fields as required and click Submit.


