


This section describes the specifics of accessing and interpreting the Fuel Sales Detailed Report.
Opening the Report
You can find the report at Reports > Fuel > Sales > Fuel Sales Detailed.
Please note that the way of opening the report, including or separately from the Diesel fuel type, is defined in the Reports Display Settings section. For more information, see Fuel Sales Detailed Opening Format.
The report is available only at the location level. Before opening the report, in the list to the left of the reports list, select the location (station) you need:

For more information, see Viewing Reports.
Viewing the Report
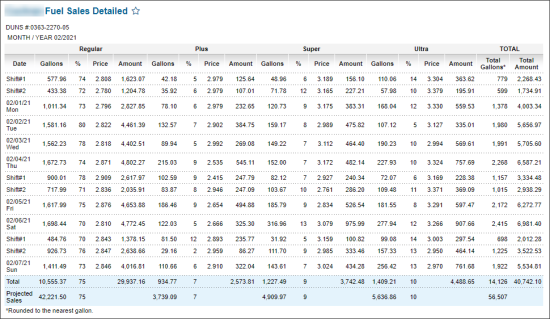
The Fuel Sales Detailed report provides the fuel sales data for the selected location (station).
The report contains the detailed sales data grouped by fuel types or grades configured on your account in the UST section. For example, the report may contain the detailed sales data for the Regular, Plus, Super, and Ultra fuel types.
Please note that the Fuel Sales Detailed report's data does not include the Fuel Loyalty value, if any configured for your location. For more information on how to enable the loyalty program, see MISC > Station Options.
For more information on how to configure fuel types, see Mix & Fuels Settings.
The report provides the following fuel sales data:
- For each fuel type or grade configured on your account, the following fuel sales data is displayed in the report:
- Liters or Gallons
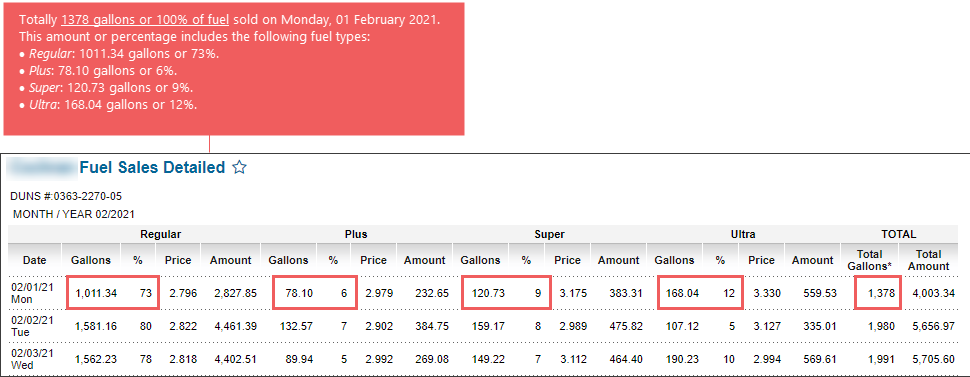
- %: The percentage proportion of each fuel type in the total fuel amount sold on a certain shift or day.
For example, in the image below, 4 fuel types sold on Monday, 01 February 2021, in the following proportions: 73% (Regular) + 6% (Plus) + 9% (Super) + 12% (Ultra) = 100%.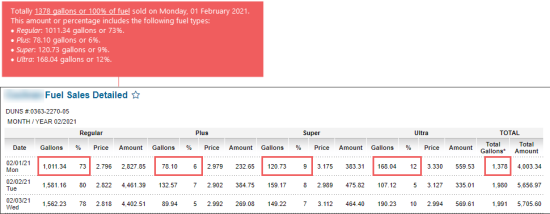
- Price: The fuel price which is calculated for each fuel type by the following formula:
Price = Amount / Gallons. - Amount
- Total Gallons
- Total Amount
- Total
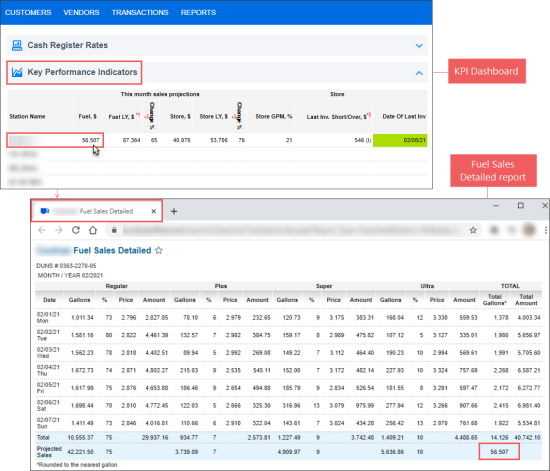
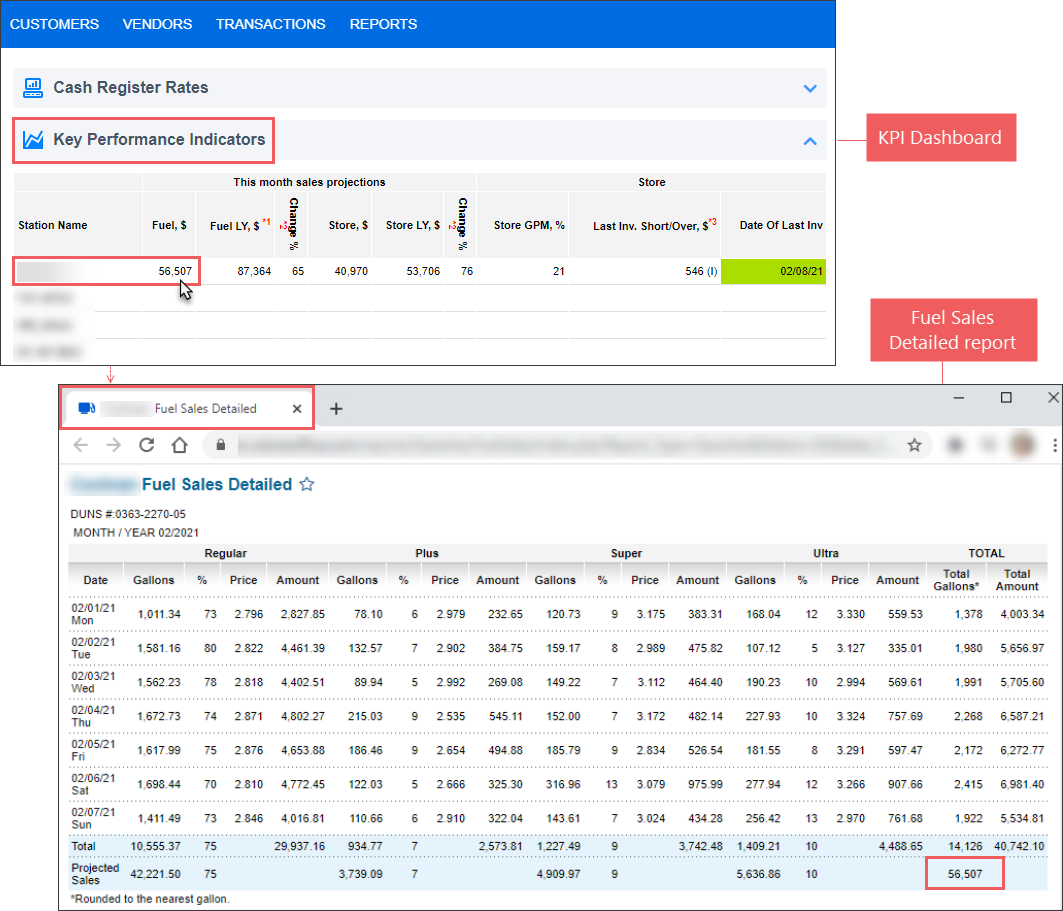
- Projected Sales: The amount of projected sales (in dollars) for the current week. This is the predicted value and, therefore, may differ from the actual sales amount.
You can also see the projected fuel sales value for the current week and the same week of the last year in the Key Performance Indicators (KPI) dashboard which is located on the main CStoreOffice® page.
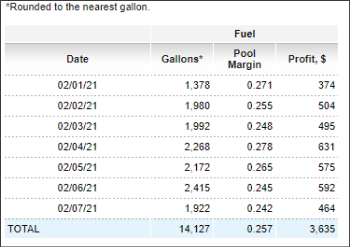
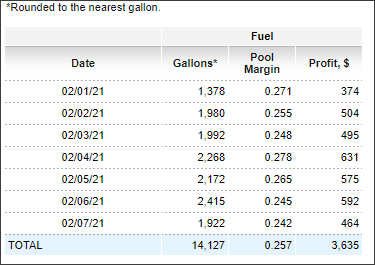
- The information about total fuel sales with the following data:
- Date
- Liters or Gallons
- Pool Margin: The margin value equals to the commission value for the commission agents.
- Profit, $
This information is taken from the Fuel Margins report. For more information, see Fuel Margins report.
Please note that the Price value in the Fuel Sales Detailed report may differ from the actual fuel price on the pump due to the following reasons:
- The Price value displayed in the report is an average and calculated value.
- The actual fuel price on the pumps may change during the shift.

The report also displays the following charts:
- Fuel Sales
- Fuel Pool Margin

Filtering the Report Data
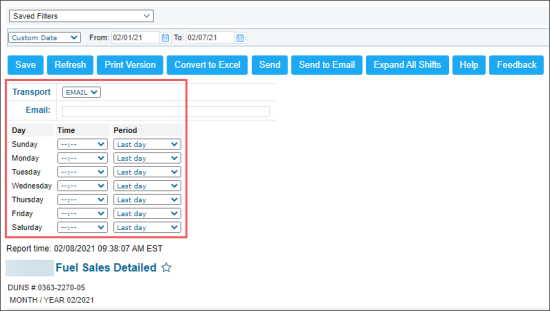
To get the exact information you need, you can apply filters to the report. To set up a filter, select one or more filtering options. Once the filter is set up, at the bottom of the filter section, click the Refresh button to display the report data by the filter criteria.
- You can specify the period you are interested in manually using the calendar or use one of the available filtering options, and then click Refresh There are the following filtering periods available:
- Custom Date
- Current Month
- Current Quarter
- Current Year
- Last Month
- Last Quarter
- Last Year
- Last 12 Months
- Select a station you are interested in from the Advanced report options.
Additional Actions
- To have the shift data expanded within the report, click Expand All Shifts.
- To view the report data only by dates without shifts expanded, click Collapse All Shifts.
- To set up the report's export:
- In the Transport list, select the method of data transferring - Email, SFTP, FTP:
- Email. Enter one or several emails where the export data will be sent.
- FTP and SFTP. Specify the following parameters:
- Host
- Path
- User Name
- Password
- From the Day and Time and Period columns, select day of the week, time and the time period for the report generation.
- Click Save.

For more information on additional report features, see Reports.


