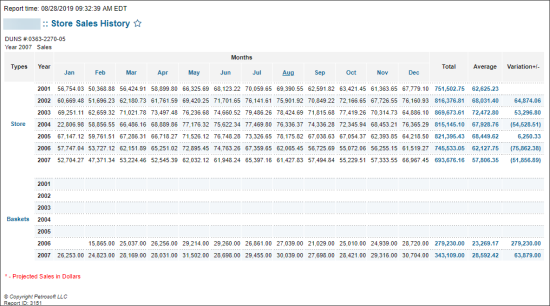
This section describes the specifics of accessing and interpreting the Store Sales History report.
Opening the Report
You can find the report at Reports > Store > Sales > Store Sales History.
The report is available only at the location level. Before opening the report, in the list to the left of the reports list, select the location (station) you need:
For more information, see Viewing Reports.
Viewing the Report
The Store Sales History report provides advanced information on the store sales for 10 years, including the current year.
The store sales data are grouped by years and months and divided into two sections:
- Store: Store sales data for the period. If you need to verify this data, you may use the PLU Sales Report section > Department Sales subsection of the shift report. For more information, see PLU Sales Report.
- Baskets
Each report section displays the following data:
- Months: Store or baskets sales amount for the specific month of the year.
- Total: Total amount for the year.
- Average: Average amount of sales or baskets for the year.
The average calculation formula: Average = Total / Number of Months. The Number of Months value is defined by the months with the store sales or baskets sales. - Variation +/-: The difference between the total amount for the previous year and for the current year.
The variation calculation formula: Variation = Total for Current Year - Total for Previous Year. If any month in the current or previous year has no data, both such months are not included into the total amount for the current or previous year. If there are no sales data for the previous year at all, the variation value for the current year is not displayed.
If there are store or basket sales only for the five months of the year, the average amount is calculated using the formula: Average = Total / 5.
In the report generated on 01 March 2019:
- Each month in the period from 01 January 2018 till 28 February 2019 has sales data.
- Each month in the period from 01 March 2019 till 31 December 2019 has no sales data.
The variation for 2019 (current year) in this case is calculated using the formula: Variation = (Total for January 2019 + Total for February 2019) - (Total for January 2018 + Total for February 2018).
In case the difference value is negative, it is displayed in brackets.
Filtering and Sorting the Report Data
If you don't need to see the report data for ten years, you can select the year you need at the top left of the report, in the Year list.
To view the detailed information about the sales in the specific month of the year, in the Store section, click the corresponding month value. The Store Sales Detailed report opens for the selected month. For details, see Store Sales Detailed report.
To view the detailed information about the sales transactions, in the Baskets section, click the corresponding month value. The Store Transactions Report opens for the selected month. For details, see Store Transactions Report.
Additional Actions
To reload the form, click Refresh.
To print the report, click Print Version.
To have the report emailed to the specified email address, click Send to Email.
To open the Petrosoft University Portal, click Help.
To create a ticket, click Feedback.
To open the report the PDF or Microsoft Excel document, hover over the Export button and then select PDF or Excel correspondingly.


