


This section describes the specifics of accessing and interpreting the Store Sales Detailed report.
Opening the Report
You can find the report at Reports > Store > Sales > Store Sales Detailed. For more information, see Viewing Reports.
Viewing the Report
The Store Sales Detailed report provides advanced information on the sales within for the specified period. Using this report, you may also analyze shift data for the period you need, including older ones.
To view this report, specify the filter by Stations or Station Tags, and filter by specific promotions. You can refine your report further by using other filtering options.
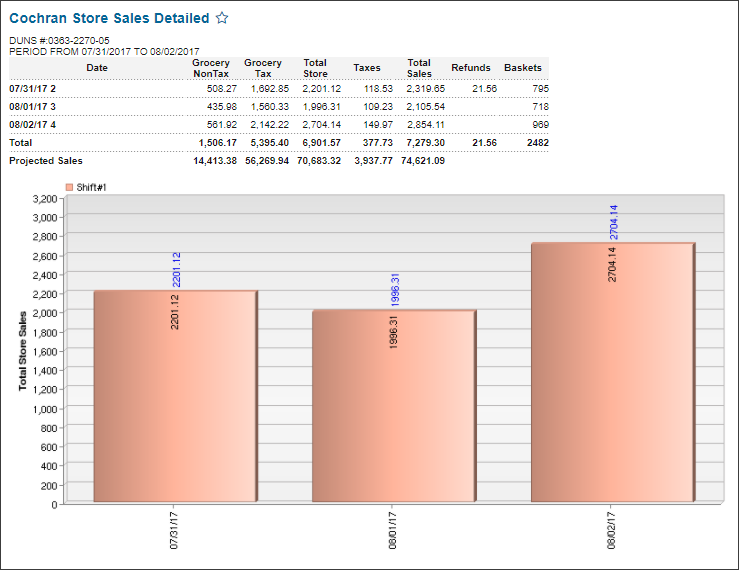
The report contains the following information:.
- Date
- Grocery NonTax
- Grocery Tax
- Total Store
- Taxes
- Total Sales
- Refunds
- Baskets
For each data listed below, the Projected Sales value is displayed at the bottom of the report's table. The Projected Sales value is calculated by the following formula:
Projected Sales = MTD + AVG Sales * Number of Days, where:
- MTD: Month-to-date is a period starting with the beginning of the current month and ending with the current day.
- AVG Sales: Average sales per day for the last 7 days.
- Number of Days: Number of days left till the end of the month.
Filtering and Sorting the Report Data
To get the exact information you need, you can apply filters to the report. To set up a filter, select one or more filtering options. Once the filter is set up, at the bottom of the filter section, click the Refresh button to display the report data by the filter criteria.
The report provides the following filtering and sorting options:
- Date. Specify the period you are interested in manually using the calendar or use one of the available filtering options, and then click Refresh There are the following filtering periods available:
- Yesterday
- Current Month
- Current Quarter
- Current Year
- Last Month
- Last Quarter
- Last Year
- Select a station you are interested in.
Additional Actions
To view the Items Sales by Promotion report, click the Sales column for the promotion you are interested in.
To view the Net Price Change report, click the Net Price Change column for the promotion you are interested in.
To view the Participation report, click the Participation column for the promotion you are interested in.
To view the Promotion Items List report, click the Items Included column for the promotion you are interested in.
To reload the form, click Refresh.
To print the report, click Print Version.
To open the report the Microsoft Excel document, click Convert to Excel.
To open the CStoreOffice® Help, click Help.
To create a ticket, click Feedback.


