


This section describes the specifics of accessing and interpreting the Loss Prevention report.
Opening Report
You can find the report at Reports > Store > Sales > Loss Prevention. For more information, see Viewing Reports.
Viewing Report
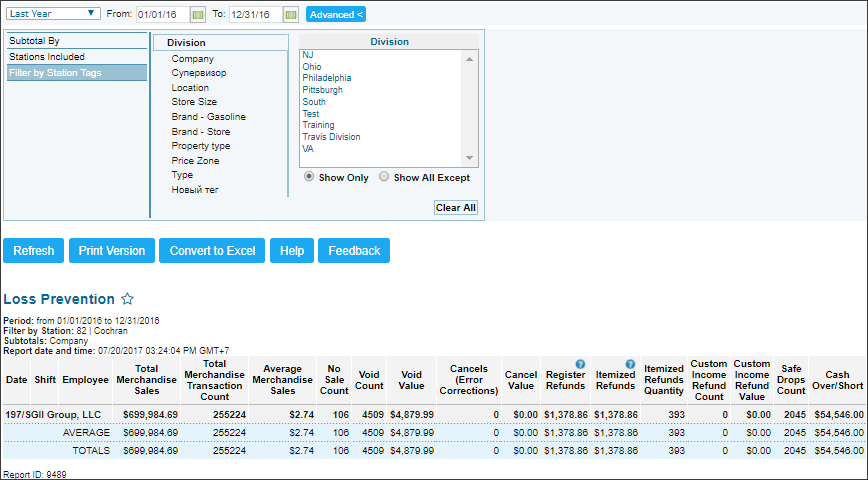
The Loss Prevention reports provides advanced information on the potentially unsafe operations for the specified period and station. Analyzing data from this reports helps you to reduce preventable losses. A preventable loss is any business cost caused by deliberate or inadvertent human actions, also known as "shrinkage".
To view this report, filter by subtotal first.
The report contains the following information:
- Date/Location/Shift Number. Date and shift number are visible when the report results are expanded.
- Total Merchandise Sales. Amount of merchandise sales.
- Total Merchandise Transaction Count. Number of merchandise sale instances.
- Average Merchandise Sales. Amount of an average merchandise sale.
- No Sale Count. Number of no sale occasions.
- Void Count. Number of no void occasions.
- Void Value. Amount of voids.
- Cancels (Error Corrections). Number of cancel occasions.
- Cancel Value. Amount canceled.
- Register Refunds. The total refunds of station sales, including Item and Fuel sales.
- Itemized Refunds. The total amount of refunds of in-store Item sales.
- Itemized Refunds Quantity . The total number of refunds of in-store Item sales.
- Custom Income Refund Count(including car wash data and money orders)
- Custom Income Refund Value (including car wash data and money orders)
- Safe Drops Count. Number of safe drop instances.
- Cash Over/Short. Amount of shortages and overages.
- Average. Accumulated average data for the specified locations.
- Totals. Total data for the specified locations.
For more information on additional report features, see Reports.
Filtering and Sorting Report Data
To get the exact information you need, you can apply filters to the report. To set up a filter, select one or more filtering options. Once the filter is set up, at the bottom of the filter section, click the Refresh button to display the report data by the filter criteria.
The report provides the following filtering and sorting options:
- Date. Specify the period you are interested in manually using the calendar or use one of the available filtering options, and then click Refresh There are the following filtering periods available:
- Yesterday
- Current Month
- Current Quarter
- Current Year
- Last Month
- Last Quarter
- Last Year
- advanced. Click the advanced button, select one several filtering options you want, and then click[ Refresh. There are the following advanced filtering options available:
- Subtotal By. Select one or several filtering options - by Common, Station tags - for the further breakdown of the results.
- Station Included. Select the stations you want to view the report for.
- Filter by Station Tags. Use this option to filter the report data by tags assigned to stations. The generated report will contain data only for those stations to which the selected tags are assigned.
To select tags by which the report data must be filtered, expand the tags tree and select the check boxes next to the necessary tags. You can filter the report data by root tags and tags of the lower level in the tags hierarchy. You can also create a combined filter by selecting different root and child tags.
Press CTRL to select several items at a time.
Select the Show Only option to view only the information for the selected items, and Show All Except to view the information for all the items except the selected ones.
Additional Actions
- To open the Average Sales Ranges report for the specific date and location, in the Average Merchandise Sales column, click the value for the chosen date and location.
- To view the detailed information about operation in the LPA video journal, click this operation for the chosen date and location. The LPA video journal is opened for all operations marked with the eye icon. For more information on the LPA product, see Loss Prevention Analytics.
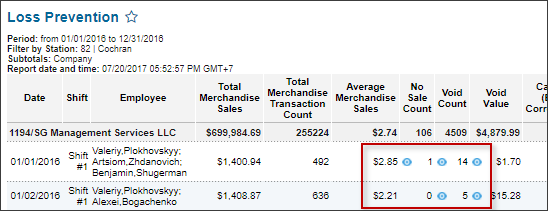
- To open the Cash Reconciliation report for the specific date and location, in the Cash Over/Short column, click the value for the chosen date and location.
If values in the Cash Over/Short column (Loss Prevention Report) and Short/Over column (Cash Reconciliation report) do not match, make sure the Fuel Deposit option is turned on in the station options form. For more information, see MISC > Station Options.


