


This section describes the specifics of accessing and interpreting the MOP Sales Consolidated report.
Opening Report
To open the report, go to Reports > Accounting > Review Sales > MOP Sales Consolidated Report.
For more information, see Viewing Reports.
Viewing Report
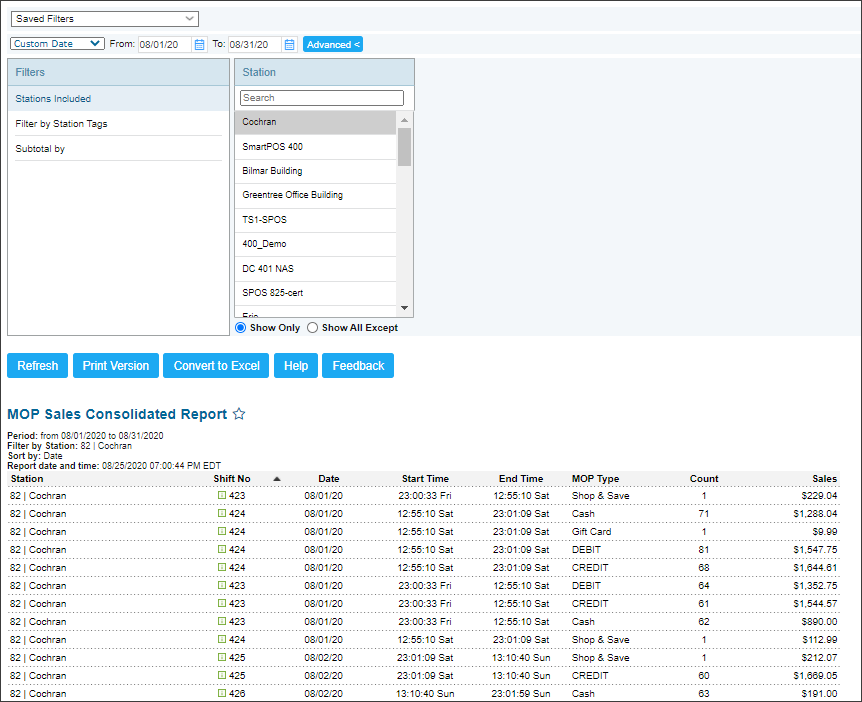
The MOP Sales Consolidated report displays the information about the MOP sales on the selected station within the specified period.
The report contains the following information:
- Station
- Shift Number
- Date
- Start Time
- End Time
- MOP Type: MOP type is displayed for the MOPs which are mapped. Otherwise, the MOP identifier is displayed. For more information on how to map MOPs in CStoreOffice®, see Adding a Custom MOP and Mapping MOPs Automatically.
- Count
- Sales
Filtering Report Data
To get the exact information you need, you can apply filters to the report. To set up a filter, select one or more filtering options. Once the filter is set up, at the bottom of the filter section, click the Refresh button to display the report data by the filter criteria.
The report provides the following filtering and sorting options:
- By date: Select this filtering option and specify the period you are interested in, and then click Refresh. There are the following filtering periods available:
- Yesterday
- Current Month
- Current Quarter
- Current Year
- Last Month
- Last Quarter
- Last Year
- Last 12 Months
- Stations Included: Select the locations for which you want to view the report.
- Filter by Station Tags: Use this option to filter the report data by tags assigned to stations. The generated report will contain data only for those stations to which the selected tags are assigned.
- Subtotal by: Select this filtering option and the subtotal option if you want to break-down the report results further.
Press CTRL, to select several items at a time.
Additional Actions
To reload the form, click Refresh.
To print the report, click Print Version.
To view the report in the Excel version, click Convert to Excel.
To open the Petrosoft University Portal, click Help.
To create a ticket, click Feedback.
To save the report to favorites, click the favorites icon next to the reports name.
For more information on additional report features, see Reports.


