


This section describes the specifics of accessing and interpreting the 6 Weeks Sales Analysis report.
Opening Report
You can find the report at Reports > Store > Sales > 6 Weeks Sales Analysis. For more information, see Viewing Reports.
6 Weeks sales analysis—How to access
This video presents the information on how to access 6 Weeks Sales Analysis report.
Viewing Report
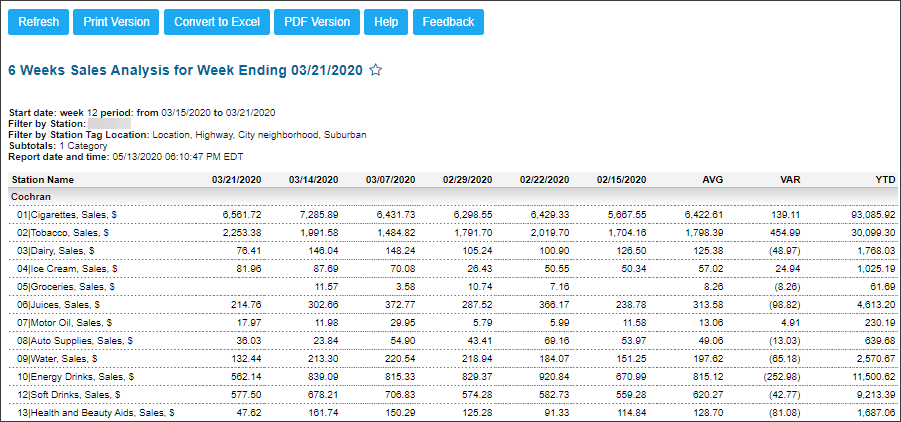
The 6 Weeks Sales Analysis report provides advanced information on the sales trends within for the last six weeks, including current week. Based on the report data you can see if sales are increasing or decreasing weekly on particular categories or departments.
The default report period is six weeks, but date ranges can be set up to show other time periods.
To view this report, specify the filter by Stations or Station Tags, and use subtotals. You can refine your report further by using other filtering options.
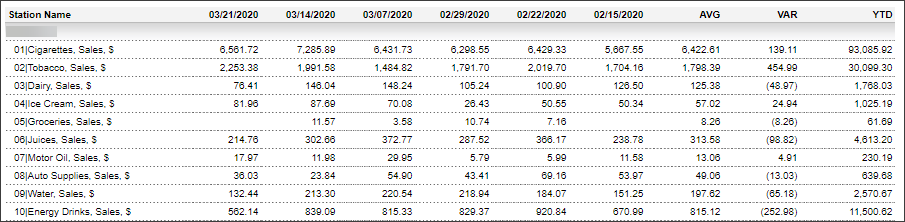
The report contains the following basic information:
- Station name: The name of the location or locations for which the report is generated.
- 6 weeks period: The sales data for 6 weeks period broken down by weeks.
- AVG: Average values for 6 weeks.
- VAR: Variations between the average sales and the current week.
- YTD: Year to date values for the selected period. The period start and end dates for this column are defined in accordance with the following criteria:
- YTD Start Date is equal to the start date of the 6 weeks period, if the start date of the 6 weeks period is less than 01 January of the current year. Otherwise, the YTD Start Date is equal to 01 January.
- YTD End Date is equal to the end date of the 6 weeks period, if the end date of the 6 weeks period is greater than today's date. Otherwise, the YTD End Date is equal to today's date.
To view more details regarding the value in the YTD column within the YTD period, click this value.
For more information on additional report features, see Reports.
Viewing the Report Detailed Data
The report data is divided into the following sections:
- Sales data within the item tag selected for subtotals in the filters
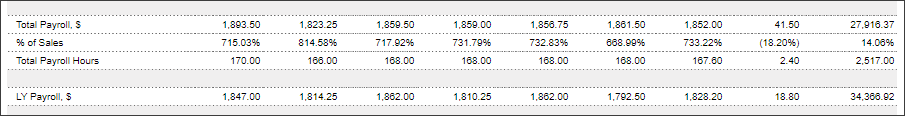
- Payroll data
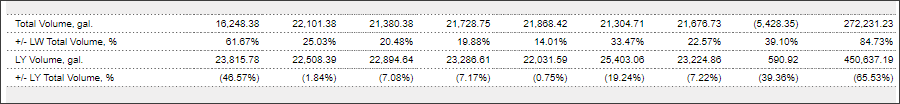
- Total Gasoline data: The gasoline sales data in this section can be verified using the Fuel Sales Detailed report. For details, see Fuel Sales Detailed Report. The Total Gasoline data section includes the following gasoline data:
- Total Volume, gal.
- +/- LW Total Volume, %: The deviations in sales within a week. The deviations value in this column is calculated using the formula: (Max - Min) / Max * 100%, where:
- Max: The maximum sales amount within a week.
- Min: The minimum sales amount within a week.
- LY Volume, gal.
- +/- LY Total Volume, %: The deviations in sales within the last year. The deviations value in this column is calculated using the formula: (Max - Min) / Max * 100%, where:
- Max: The maximum sales amount within the last year.
- Min: The minimum sales amount within the last year.
- To check and verify the gasoline sales data for a certain week, click the sales data for this week.
- To check and verify the gasoline sales data for the year to date period, click the corresponding value in the YTD column.
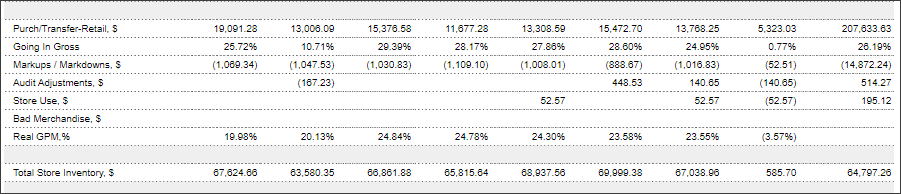
- Purchases and inventory data
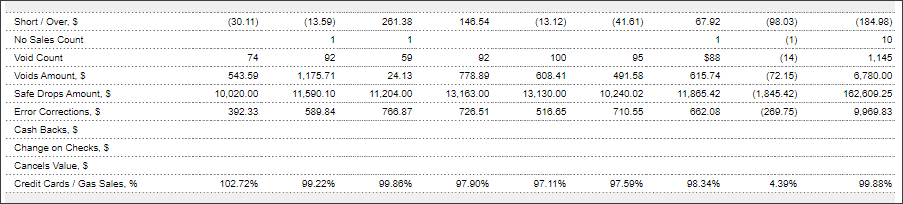
- Customer count data
- Other sales data
- Miscellaneous Income
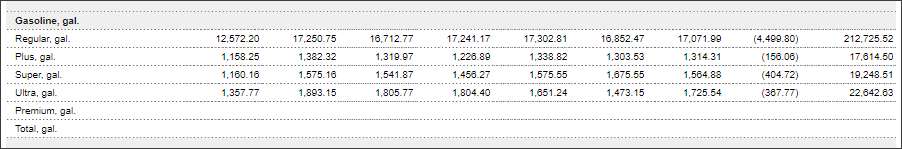
- Gasoline, gal.
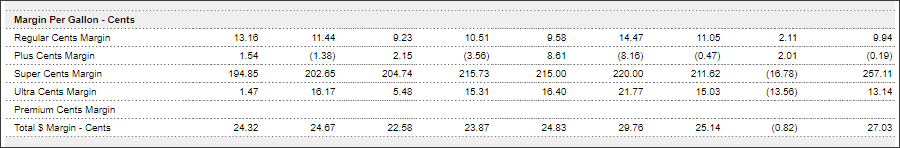
- Margin per Gallon - cents
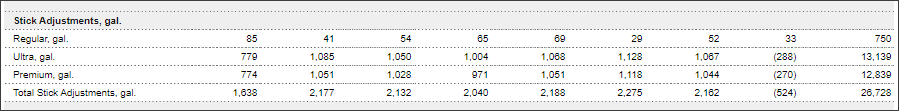
- Stick Adjustments, gal.
- Total: In the Total section, all the listed above sections are displayed with the totals for all stations selected in the report filters.
Please note that for each value in the YTD column, the corresponding report opens for the YTD period which may differ from the selected 6 weeks period. For more information on how the YTD period is calculated, see YTD.


Please note that the Retail and Margin values, if any, are calculated considering the taxes if they are configured in the Taxation Setup form.
Filtering and Sorting Report Data
To get the exact information you need, you can apply filters to the report. To set up a filter, select one or more filtering options. Once the filter is set up, at the bottom of the filter section, click the Refresh button to display the report data by the filter criteria.
The report provides the following filtering and sorting options:
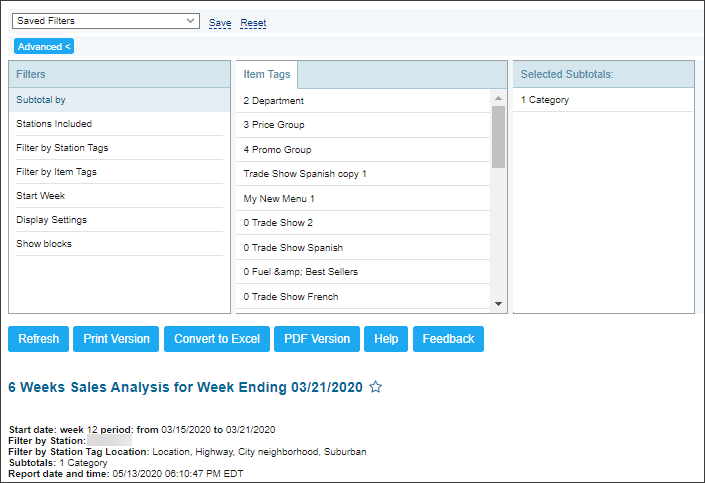
- advanced. Click the advanced button, select one several filtering options you want, and then click[ Refresh. There are the following advanced filtering options available:
- Subtotal By. Select Item Tags to break-down the report results further.
- Station Included. Select the stations you want to view the report for.
- Filter by Station Tags. Use this option to filter the report data by tags assigned to stations. The generated report will contain data only for those stations to which the selected tags are assigned.
To select tags by which the report data must be filtered, expand the tags tree and select the check boxes next to the necessary tags. You can filter the report data by root tags and tags of the lower level in the tags hierarchy. You can also create a combined filter by selecting different root and child tags. - Filter by Item Tags. Use this option to filter the report data by tags assigned to items. The generated report will contain data only for those items to which the selected tags are assigned.
To select tags by which the report data must be filtered, expand the tags tree and select the check boxes next to the necessary tags. You can filter the report data by root tags and tags of the lower level in the tags hierarchy. You can also create a combined filter by selecting different root and child tags. - Start Week. Select the week to start the 6 weeks period.
- Display Settings. Select the purchases display type - total or detailed, and select if you want the total showed by divisions.
- Show blocks. Select the following additional blocks to be displayed in the report, if needed:
- Gasoline Gallons
- Margin per Gallons - Cents
- Stick Adjustments
Press CTRL to select several items at a time.
Select the Show Only option to view only the information for the selected items, and Show All Except to view the information for all the items except the selected ones.


