


This section describes the specifics of accessing and interpreting the Price Change by Tags report.
Opening the Report
You can access this report in either of the following ways:
- Go to Reports > Store > Merchandise > Maintenance > Price Change by Tags.
- In the Store GPM Report, go to the GPM calculation table and then click any value in the Price Change row.
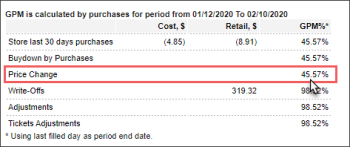
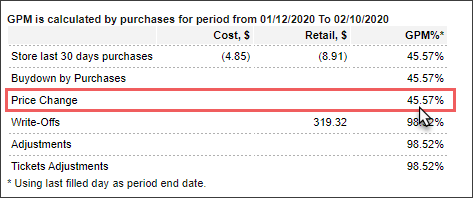
Viewing the Report
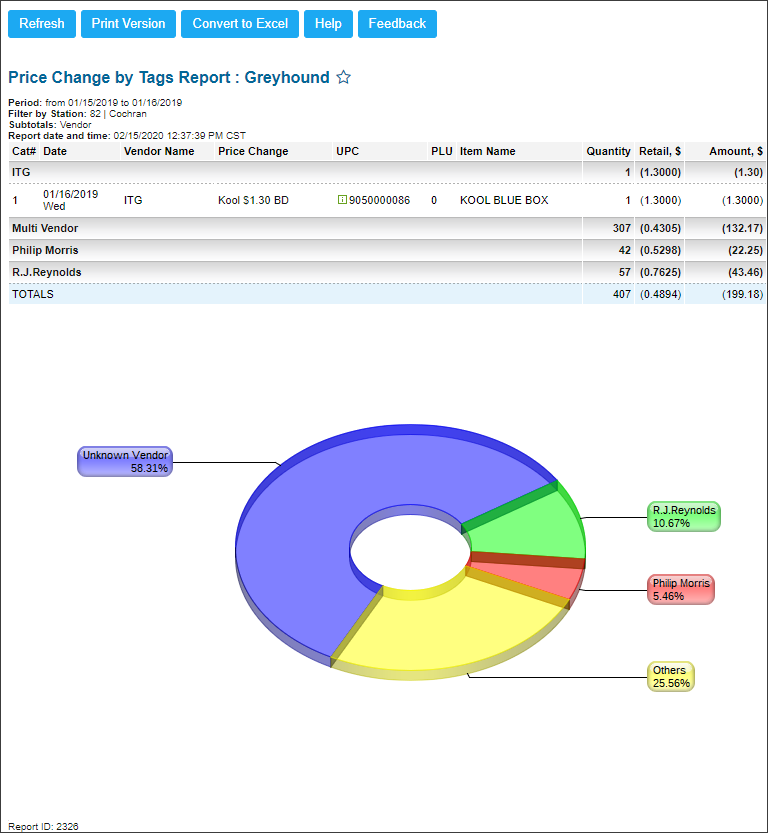
The Price Change by Tags report provides advanced information on price changes.
The report contains of the following information:
- Category number
- Date
- Vendor name
- Price change name
- UPC: To open the item setup form, click the item's UPC.
- PLU
- Item name
- Quantity
- Retail
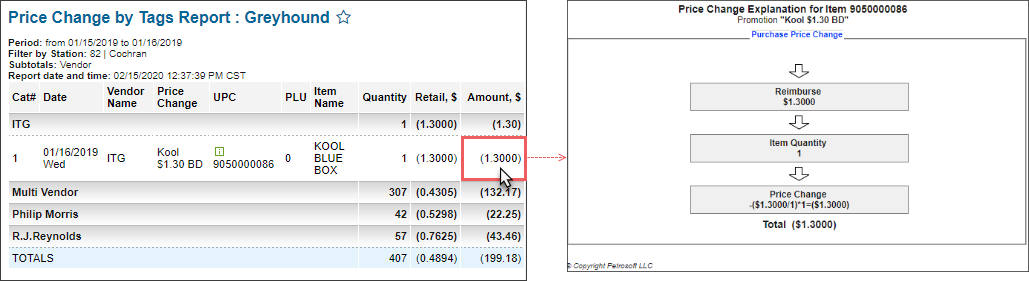
- Amount: The Amount value is calculated using the formula: Amount = (Special Price Reduction / Special QTY - Item Retail + Reimburse) x Item QTY.
- Graph of the price changes grouped by vendors
For more information on additional report features, see Reports.
Filtering and Sorting the Report Data
To get the exact information you need, you can apply filters to the report. To set up a filter, select one or more filtering options. Once the filter is set up, at the bottom of the filter section, click the Refresh button to display the report data by the filter criteria.
The report provides the following filtering and sorting options:
- Custom Date. Specify the period you are interested in manually using the calendar or use one of the available filtering options, and then click Refresh There are the following filtering periods available:
- Yesterday
- Current Month
- Current Quarter
- Current Year
- Last Month
- Last Quarter
- Last Year
- Last 12 Months
- advanced. Click the advanced button, select one several filtering options you want, and then click Refresh. There are the following advanced filtering options available:
- Subtotal By. Select one or several filtering options for the further breakdown of the results - Common, Station Tags, Item Tags.
- Filter by Station Tags. Use this option to filter the report data by tags assigned to stations. The generated report will contain data only for those stations to which the selected tags are assigned.
To select tags by which the report data must be filtered, expand the tags tree and select the check boxes next to the necessary tags. You can filter the report data by root tags and tags of the lower level in the tags hierarchy. You can also create a combined filter by selecting different root and child tags. - Filter by Item Tags. Use this option to filter the report data by tags assigned to items. The generated report will contain data only for those items to which the selected tags are assigned.
To select tags by which the report data must be filtered, expand the tags tree and select the check boxes next to the necessary tags. You can filter the report data by root tags and tags of the lower level in the tags hierarchy. You can also create a combined filter by selecting different root and child tags. - Filter by Items. Select the items you want.
- Filter by Vendors. Select the vendors you want.
- Shift. Select the shifts you are interested in from the 'From' and 'To' fields.
- Sort by. Select the order of the report columns you want. Select the Ascending or Descending option for the corresponding type of filtering.
Press CTRL, to select several items at a time.
Select the Show Only option to view only the information for the selected items, and Show All Except to view the information for all the items except the selected ones.
Additional Actions
To view the Price Change explanation for a certain item, click the item's amount.
To reload the form, click Refresh.
To print the report, click Print Version.
To open the report in the Microsoft Excel document, click Convert to Excel.
To open the Petrosoft University Portal, click Help.
To create a ticket, click Feedback.


