


This section describes the specifics of accessing and interpreting the Store GPM report.
Opening the Report
You can find the report at Reports > Store > Merchandise > GPM > Store GPM.
The Store GPM report can be opened at all levels:
- Account
- Company
- Division
- Location (Station)
For more information, see Viewing Reports.
Store GPM—How to access
This video presents the information on how to access Store GPM report.
Viewing the Report
The Store GPM report is a store level report that can show GPM at the store level, or at the category level. This report is calculated by purchases for 30 days, so you can see daily how the GPM% is flowing. This report also displays more accurate GPM% for Ingredient Method of Accounting categories.
For the most accurate GPM on Ingredient Method of Accounting categories, it is recommended that cost inventories are done monthly for a more accurate representation of GPM%.
To view the report, use subtotal by item tags and click Refresh.
Please note that the maximum report period is limited to the last twelve months.
The Store GPM report consists of the following sections:
This section of the report displays the GPM fluctuation for the specific period.
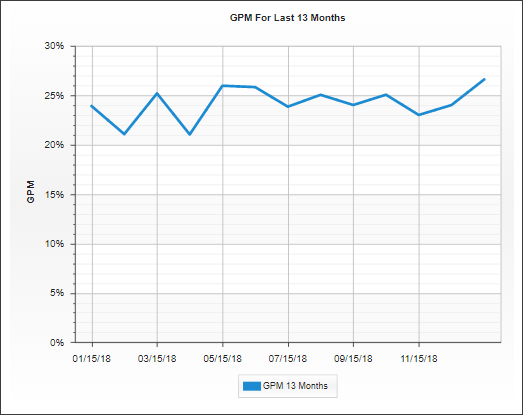
To view the GPM Explanation for the specific period, select this period from the graph.
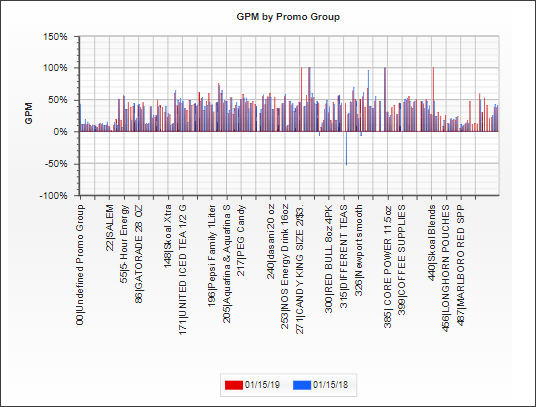
This section of the report displays the GPM for the period broken down by the selected item tag.
This section of the report displays the following data:
- GPM results by category represented in a pie chart
- Items with cost increased
- Cost exceptions
- Low margin sales
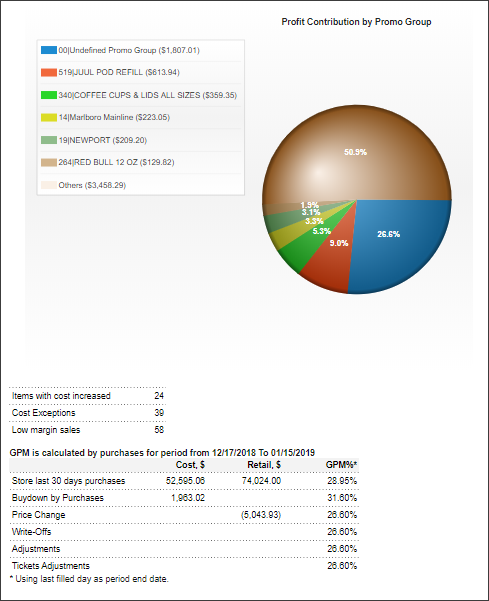
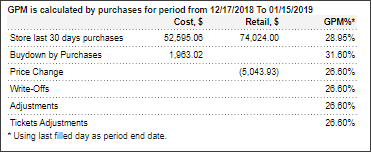
The Cost value is calculated in this section based on the purchases for the last 30 days.
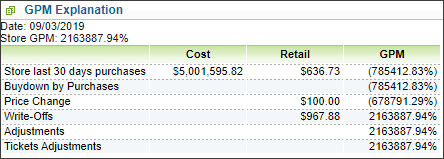
This section of the report displays the summarized GPM calculation information:
- Store last 30 days purchases. Click to view the Store Purchases report.
- Buydown by purchases. Click to view the Buydowns by Purchases report.
- Price change. Click to view the Price Change report.
- Write-Offs. Click to view the Write-Offs by Tags report.
- Adjustments.
- Tickets adjustments. Click to view the Ticket Adjustments report.
This section of the report displays the sales information grouped by margin.
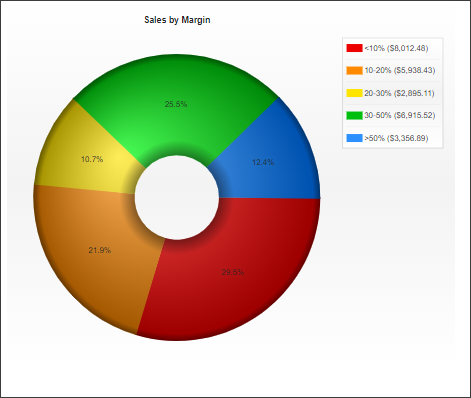
To view the Profit Contribution report for the specific GPM range, click the range you want.
This section of the report displays the price change leading promotions.
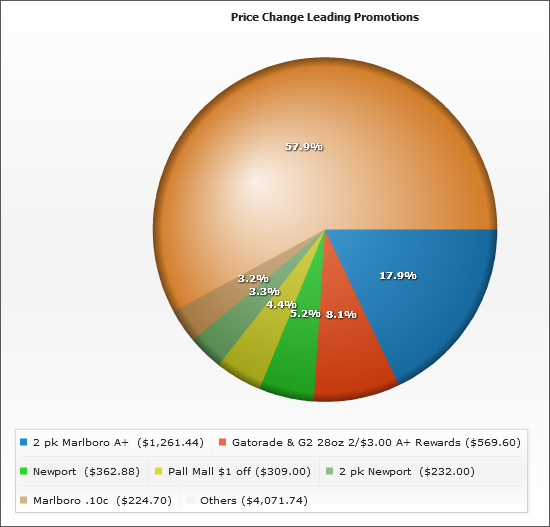
To view the Price Change report for the corresponding promotion, click the corresponding part of the pie chart.
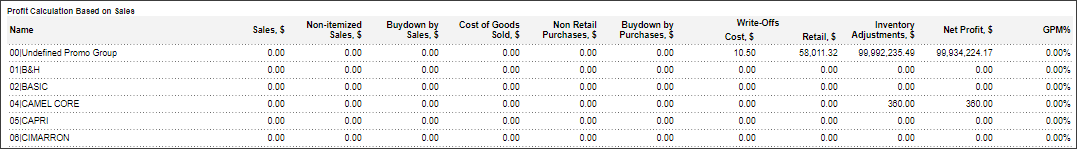
This section of the report displays the following data:
- Category name
- Sales amount
- Non-itemized sales
- Buydown sales
- Cost of goods sold
- Non retail purchases
- Buydown by purchases
- Write-Offs: Cost and Retail
- Inventory adjustments
- Net Profit: The Net Profit calculation formula: Net Profit = (Sales + Non-Itemized Sales + Buydown by Sales + Buydown by Purchases) - (Cost of Goods Sold + Non Retail Purchases + Write-Offs / Retail + Inventory Adjustments).
- GPM %: The GPM % calculation formula: GPM % = (Net Profit / (Sales + Non-Itemized Sales)) x 100%.
Filtering and Sorting the Report Data
To get the exact information you need, you can apply filters to the report. To set up a filter, select one or more filtering options. Once the filter is set up, at the bottom of the filter section, click the Refresh button to display the report data by the filter criteria.
The report provides the following filtering and sorting options:
- Custom Date. Specify the period you are interested in manually using the calendar or use one of the available filtering options, and then click Refresh. There are the following filtering periods available:
- Yesterday
- Current Month
- Current Quarter
- Current Year
- Last Month
- Last Quarter
- Last Year
- Last 12 Months
- advanced. Click the advanced button, select one several filtering options you want, and then click[ Refresh. There are the following advanced filtering options available:
- Subtotal By. Select one the filtering options for the further breakdown of the results - Item Tags.
- Station Included. Select the stations you want to view the report for.
- Filter by Station Tags. Use this option to filter the report data by tags assigned to stations. The generated report will contain data only for those stations to which the selected tags are assigned.
To select tags by which the report data must be filtered, expand the tags tree and select the check boxes next to the necessary tags. You can filter the report data by root tags and tags of the lower level in the tags hierarchy. You can also create a combined filter by selecting different root and child tags. - Include write-offs and inventory adjustments: By default, write-offs and inventory data is included into the report's data. To exclude this data, unselect this option.
Please note that the maximum custom period you can generate the report for is limited to last 12 months.
Press CTRL, to select several items at a time.
Select the Show Only option to view only the information for the selected items, and Show All Except to view the information for all the items except the selected ones.


