


Direct Connect Connection Monitoring report
This section describes the specifics of accessing and interpreting the Direct Connect Connection Monitoring report and consists of the following sections:
- Opening the Report
- Viewing the Report
- Activating Report's Email Notifications
- Filtering and Sorting Report Data
- Additional Actions
Opening the Report
To open the Direct Connect Connection Monitoring report in CStoreOffice®:
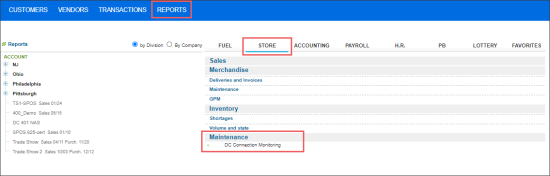
- From the CStoreOffice® main page, go to Reports > Store.
- In the left menu, select the account, company, division, or station, for which you want to generate the report.
- In the list of store reports, go to the Maintenance section and click DC Connection Monitoring.

Viewing the Report
The Direct Connect Connection Monitoring report monitors and displays the following data on the connection status:
- Current connection status for all stations with the cash register transport enabled.
- Total statistics on shift and PJR files.
The report reloads automatically each five minutes to display the latest data.
You can view the DC Connection Monitoring report in the following two modes:
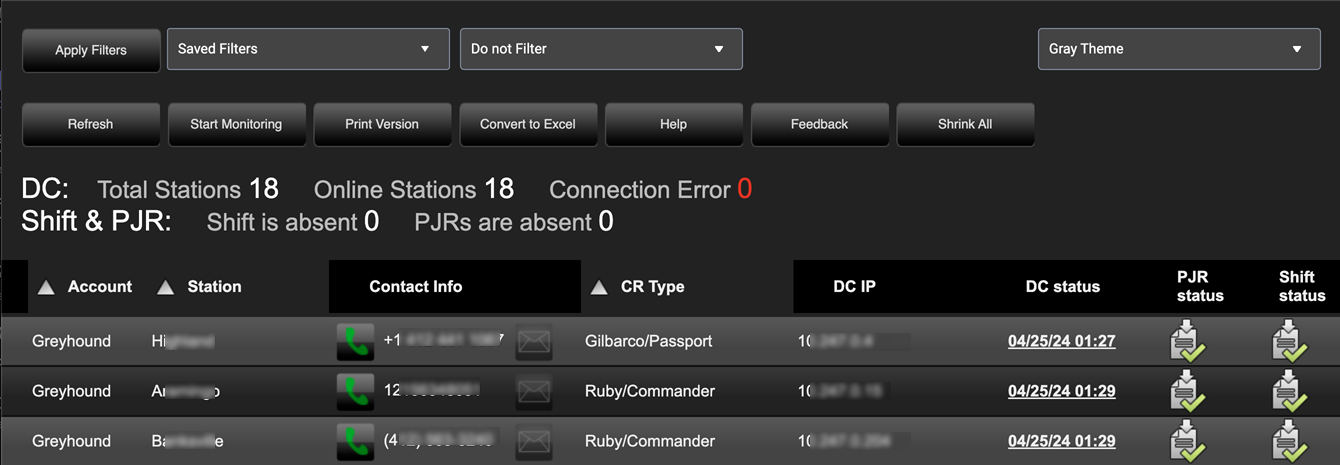
- Gray Theme: This mode is recommended to monitor the connection status on large screens with resolution of 1920x1280.
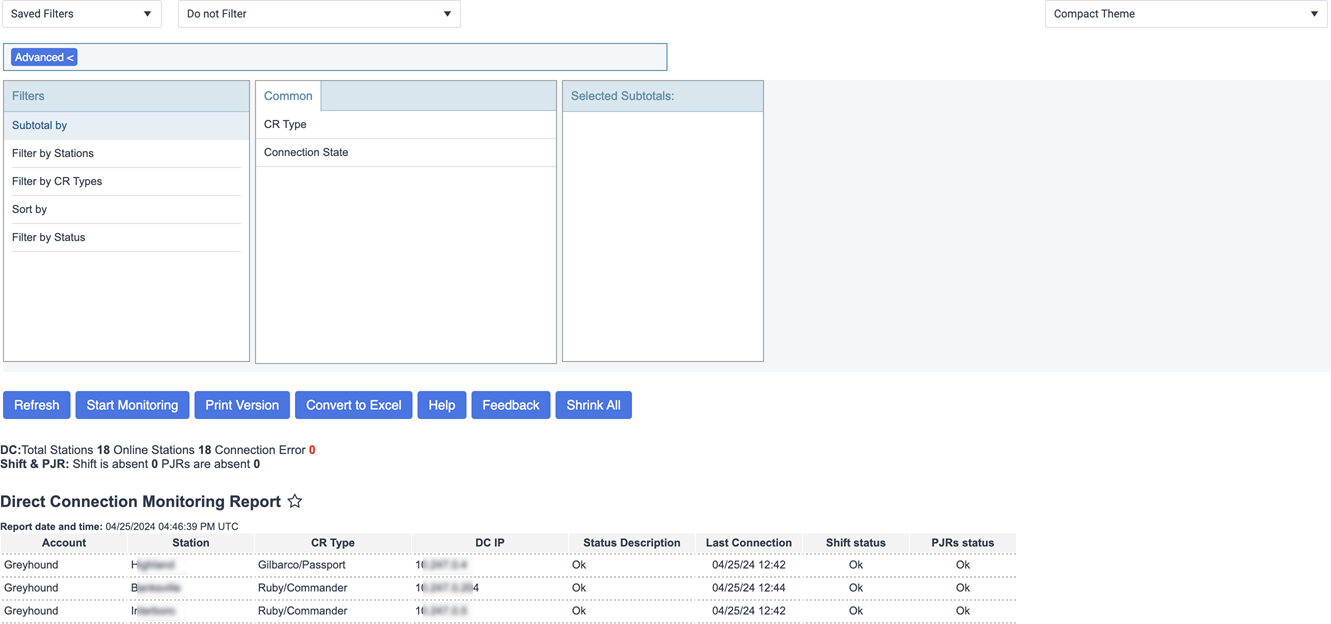
- Compact Theme: The standard report view used in CStoreOffice®.
This mode is selected by default.
- To switch to the Gray Theme mode, at the top right of the report, click the view switcher and select Gray Theme.
- To switch to the Compact Theme mode, at the top right of the report, click the view switcher and select Compact Theme.
The DC Connection Monitoring report displays the following data:
Report Header Data
In the report header you can view the total connections statistics on the following data:
- DC:
- Total Stations
- Not in Service
- Connection Error
- Shift & PJR:
- Shift is absent
- PJRs are absent
Main Report Data
- Account: Account name.
- Station: Station name.
- Contact Info: Contains the telephone number of the station. This column is available only in the Gray Theme mode.
- CR Type: Cash register type.
- DC IP: Direct Connect IP address.
- Status Description: Connection status description. May have the following values:
- Acumera Communication Interruption
- Awaiting Installation
- Cash Register Communication Interruption
- Cash Register shared folders interruption
- Check Cash Register credentials
- Configuration mismatch
- Internet Communication Interruption
- Location offline for more than 30 days
- Ok: Station is online. No connection issues.
- PJRs are absent
- Service interruption
- Shift is absent
- Subscription Expired
- DC Status: Displays the icon that indicates if the station's DC Box is connected or not. Near the icon, the date and time of the last successful connection is displayed. This column is available only in the Gray Theme mode.
- PJR Status: Displays the file icon that indicates if PJR files are received on this station or not. This column is available only in the Gray Theme mode.
- Shift Status: Displays the file icon that indicates if the shift files are received on this station or not. This column is available only in the Gray Theme mode.
- Last Connection: The date and time of the last successful connection.
- Monitoring > Start Now: Click this button to get the up-to-date connection data for the station.
- DC status: Displays the icon that indicates if the station's DC Box is connected or not. Near the icon, the date and time of the last successful connection is displayed. This column is available only in the Gray Theme mode.
- PJR Status: Displays the file icon that indicates if PJR files are received on this station or not.
- Shift Status: Displays the file icon that indicates if the shift files are received on this station or not.
See How to resolve connection statuses for information on how you can resolve the occurred statuses.
Hover over the DC status, PJR status, or Shift status icon to get more details about the status.
To get the latest connection data for all stations displayed in the report, below the report's header, click the Start Monitoring button.
Hover over the DC status, PJR status, or Shift status icon to get more details about the status.
Activating Report's Email Notifications
If you need to get notified promptly by the system about any of the station connection issues, activate the personal alerts. As a result, you will get system notifications to your CStoreOffice® authentication or any other email specified in your personal data.
For more information on how to activate the report's email notifications, see Personal Alerts.
You can also use the Reports Scheduling feature to set up the advanced notification settings for the report.
For more information on how to set up the schedule for the report, see Reports Scheduling.
Filtering and Sorting Report Data
To get the exact information you need, you can apply filters to the report. To set up a filter, select one or more filtering options. Once the filter is set up, at the bottom of the filter section, click the Refresh button to display the report data by the filter criteria.
To open the filtering and sorting options:
- In the Gray Theme mode, at the top left of the report, click the plus icon.
- In the Compact Theme mode, click the Advanced button.
The report provides the following filtering and sorting options:
- Subtotal By: Select one of the subtotal options - by CR Type or Connection State - if you want to break-down the report results further.
- Filter by Stations: Select the stations you want to view the report for.
- Filter by CR Types: Select the CR type you want to view the report for.
- Filter by Status: Select the connection status you want to view the report for.
- Sort by. Select the order of the report columns you want. Select the Ascending or Descending option for the corresponding type of filtering.
- Filter by Status: Select the connection status you want to view the report for. In the right pane, you can see only actual statuses in the stations.
Press and hold Ctrl if you use Windows OS or Command (or Cmd) if you use MacOS and click the items you want to select.
Additional Actions
You can perform the following operations with the report:
- To reload the report, click Refresh.
- To get the latest connection data for all stations displayed in the report, click Start Monitoring.
- To print the report, click Print Version.
- To view the report in the Excel version, click Convert to Excel.
- To open the relevant help page, click Help.
- To create a ticket, click Feedback.
- To, collapse or expand the report data, click Shrink All or Expand All correspondingly.


