This section describes the specifics of accessing and interpreting the Fuel Sales Comparison report.
Opening the Report
You can find the report at Reports > Fuel > Sales > Fuel Sales Comparison.
The Fuel Sales Comparison report can be opened at all levels:
- Account
- Company
- Division
- Location (Station)
For more information, see Viewing Reports.
Viewing the Report
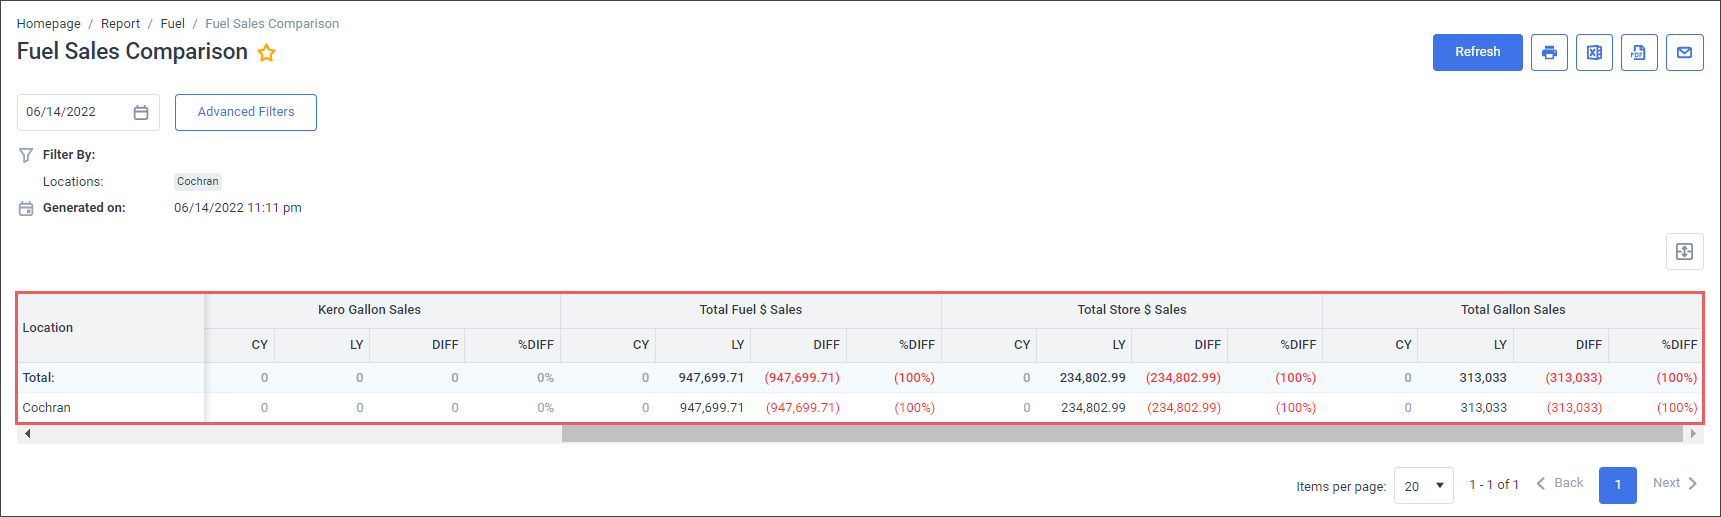
The Fuel Sales Comparison report provides the fuel sales data by fuel types for the selected locations (stations).
For more information on how to configure fuel types, see Mix & Fuels Settings.
The report provides the following fuel sales data:
- In the Total Gasoline Gallon Sales columns:
- CY: Fuel sales at the selected date in the current year.
- LY: Fuel sales at the selected date in the last year.
- DIFF: Difference between fuel sales at the selected date in the current and last years.
- % DIFF: Percentage difference between fuel sales at the selected date in the current and last years.
- For each fuel type:
- CY: Fuel sales at the selected date in the current year.
- LY: Fuel sales at the selected date in the last year.
- DIFF: Difference between fuel sales at the selected date in the current and last years.
- % DIFF: Percentage difference between fuel sales at the selected date in the current and last years.
- In the Total Fuel Sales, Total Store Sales, and Total Gallon Sales columns:
- $ CY: Total fuel sales at the selected date in the current year.
- $ LY: Total fuel sales at the selected date in the last year.
- $ DIFF: Total difference between fuel sales at the selected date in the current and last years.
- % DIFF: Total percentage difference between fuel sales at the selected date in the current and last years.
Filtering and Sorting the Report Data
To get the exact information you need, you can apply filters to the report. To set up the report filters:
- Click Advanced Filters.
- Select one or more filtering options.
- At the bottom of the filtering options form, click Accept.
- At the top right of the report form, click Refresh.
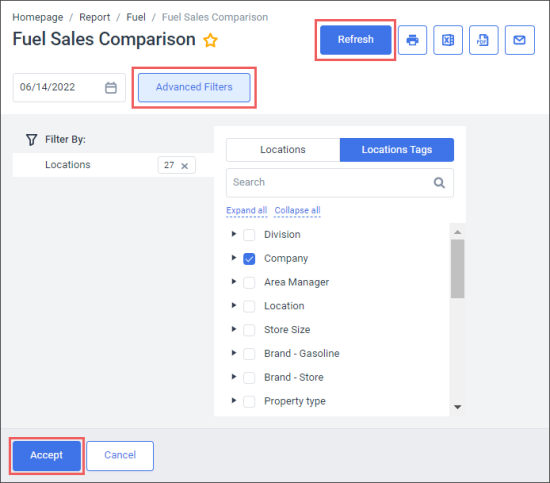

The report provides the following filtering options:
- Date: Select the date for which to display the data inclusively and then click Refresh.
- Filter by Locations: Select the stations (locations) you want to view the report for.
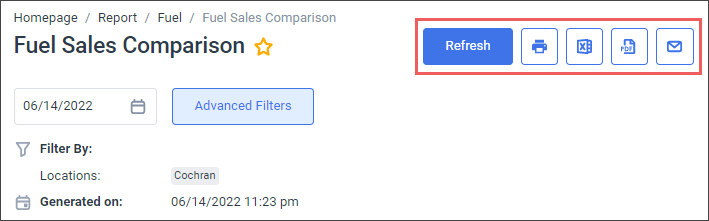
Additional Actions
- To reload the report form, click Refresh.
- To print the report, click the printing button.
- To view the report in the Excel version, click the Excel button. You may select if the subtotals should be expanded or collapsed in the Excel file.
- To view the report in the PDF format, click the PDF button. You may select if the subtotals should be expanded or collapsed in the Excel file.
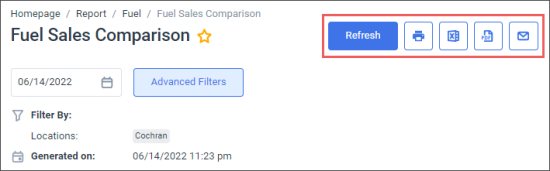
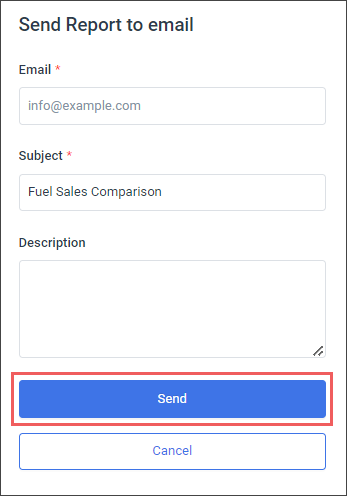
- To have the report emailed to you:
- Click the email button.
- In the Send Report to email form:
- In the Email field, enter the email to which you are going to send the report.
- In the Subject field, the report name is populated automatically. You can adjust it, if needed.
- In the Description field, enter any additional comments to the email, if needed.
- Click the Send button.