


This section describes the specifics of accessing and interpreting the MOPs Summary report, previously named as Credit/Debit Cards Summary report.
Please note that the MOPs Summary report displays the credit card details data only for the Ruby Verifone and Radiant cash registers. For all other CR types, the credit card data is not visible in the report.
Opening the Report
You can find the report at Reports > Accounting > Manage Credit Cards > MOPs Summary.
The MOPs Summary report can be opened at all levels:
- Account
- Company
- Division
- Location (Station)
For more information, see Viewing Reports.
Viewing the Report
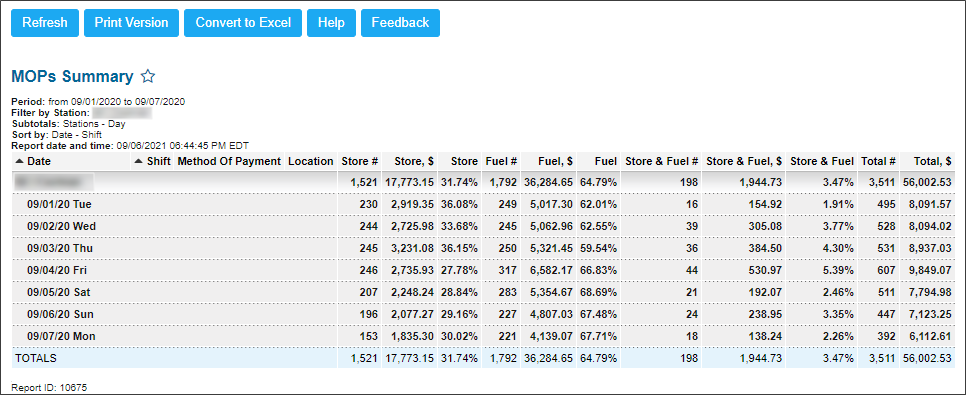
The MOPs Summary report displays the detailed information on store and fuel sales by MOPs for shifts.
The report contains the following information:
- Date
- Shift
- Method of Payment
- Location
- Store #: Number of store sales.
- Store $: Amount of store sales.
- Store %: Percentage of store sales.
- Fuel #: Number of fuel sales.
- Fuel $: Amount of fuel sales.
- Fuel %: Percentage of fuel sales.
- Store and Fuel #: Sum of the store and fuel sales.
- Store and Fuel $: Amount of the store and fuel sales combined.
- Store and Fuel %: Percentage of the store and fuel sales combined.
- Total #: (Store # + Fuel # + Store & Fuel #)
- Total $: (Store $ + Fuel $ + Store & Fuel $)
If there is no house account data in the report, make sure the Process House Account Details option is selected in the Station Options > MISC section. For details, see Station Options: MISC.
Filtering and Sorting the Report Data
To get the exact information you need, you can apply filters to the report. To set up a filter, select one or more filtering options. Once the filter is set up, at the bottom of the filter section, click the Refresh button to display the report data by the filter criteria.
The report provides the following filtering and sorting options:
- By date: Select this filtering option and specify the period you are interested in, and then click Refresh. There are the following filtering periods available:
- Yesterday
- Current Month
- Current Quarter
- Current Year
- Last Month
- Last Quarter
- Last Year
- Last 12 Months
- advanced: Click the advanced button, select one several filtering options you want, and then click[ Refresh. There are the following advanced filtering options available:
- Subtotal By: Select one or several filtering options - by Common, Station tags - for the further breakdown of the results.
- Station Included: Select the stations you want to view the report for.
- Filter by Station Tags: Use this option to filter the report data by tags assigned to stations. The generated report will contain data only for those stations to which the selected tags are assigned.
To select tags by which the report data must be filtered, expand the tags tree and select the check boxes next to the necessary tags. You can filter the report data by root tags and tags of the lower level in the tags hierarchy. You can also create a combined filter by selecting different root and child tags. - Sort By: Select the order of the report columns you want to be displayed after the Date column. There are the following sorting options available:
- In First Turn: Select the column to be displayed first.
- In Second Turn: Select the column to be displayed second.
Press CTRL, to select several items at a time.
For more information on additional report features, see Reports.


