The Dashboard screen brings together all your key metrics and operational insights in one central location. See how your business is performing, make data-driven decisions, and optimize your operations - all in one place.
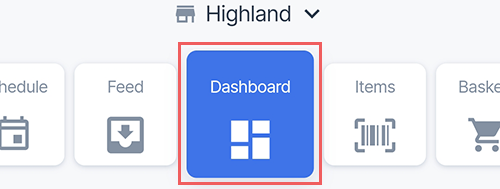
Uncover key business metrics with these reports:
- Store Sales
- Store GPM
- Store Profit by Category
- Store Inventory by Category
- Store Inventory Adjustments
- Fuel Sales (Gal)
- Fuel Profit
- Pool Margin
- Fuel Prices
- Fuel Inventory
- Competitors Fuel Prices
- Loss Prevention Live Cameras
- Loss Prevention Sales
Personalizing dashboard
You can rearrange reports on the dashboard to simplify navigation and prioritize the ones you use most often.
- Scroll down to the bottom of the screen.
- Tap Customize Dashboard button.
- Drag and drop the reports to your preferred order.
- Tap Accept button to apply changes.
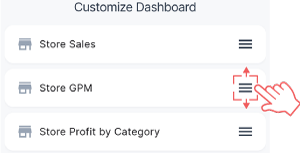
To revert to the original order of reports, tap Default button.
Store Sales report
The total sales amount for the location, projected and reported for the selected period.
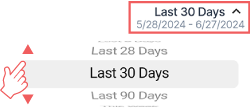
- Tap the dates interval in the top-right corner of the widget and scroll to the required period (from 1 week to 1 year)
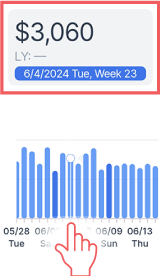
- Swipe the aggregated numbers to see the sales amount for the selected date, projection, this month, and this year sales statistics.
- Tap the line on the graph to see the total sales amount for that date.

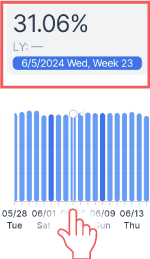
Store GPM report
Gross Profit Margin (GPM) rate for the location, calculated by dividing gross profit by sales and multiplying by 100. Projected and reported for the selected period.
- Tap the dates interval in the top-right corner of the widget and scroll to the required period (from 1 week to 1 year)
- Swipe the aggregated numbers to see the GPM percentage for the selected date, projected percentage, and aggregated statistics for this month and this year.
- Tap the line on the graph to see the total sales amount for that date.


Store Profit by Category report
The merchandise profit amount for the location, projected and reported for the selected period. This report offers aggregated profit statistics alongside detailed breakdowns for each merchandise category.
Swipe the aggregated numbers to see the aggregated profit for the current date, projected profit, and aggregated profit for this month and this year.

Store Inventory by Category report
The inventory amount for the location at the current date. This report offers aggregated inventory amount alongside detailed breakdowns for each merchandise category.
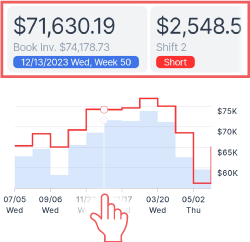
Store Inventory Adjustments report
The history of inventory adjustments made for the location.
Tap the graph to see the aggregated inventory statistics for that date.
Fuel Sales (Gal) report
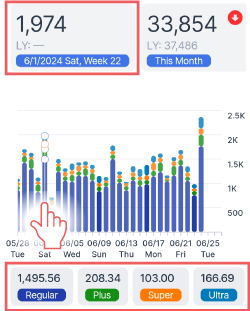
The amount of fuel (gallons) sold at this location during the selected period.
- Tap the dates interval in the top-right corner of the widget and scroll to the required period (from 1 week to 1 year)
- Swipe the aggregated numbers to see the amount of fuel sold for the selected date, this month, and this year.
- Tap the line on the graph to see the total amount sold for that date with a breakdown on fuel types.


Fuel Profit report
The aggregated profit amount from fuel sales for the location, projected and reported for the selected period.
- Tap the dates interval in the top-right corner of the widget and scroll to the required period (from 1 week to 1 year)
- Swipe the aggregated numbers to see the fuel profit amount for the selected date, projected profit, and aggregated profit statistics for this month and this year.
- Tap the line on the graph to see the total profit amount for that date.


Pool Margin report
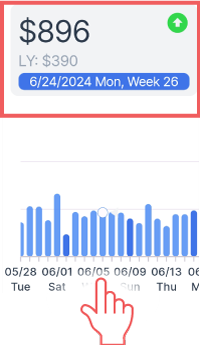
The estimate of total profit per gallon based upon the gasoline sales price versus cost of gasoline per gallon. The numbers are calculated for the location for the selected period.
- Tap the dates interval in the top-right corner of the widget and scroll to the required period (from 1 week to 1 year)
- Swipe the aggregated numbers to see the fuel pool margin for the selected date, this month, and this year.
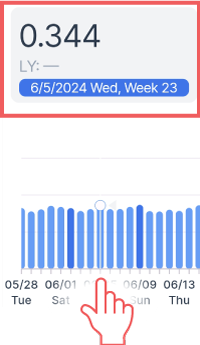
- Tap the line on the graph to see the pool margin for that date.


Fuel Prices report
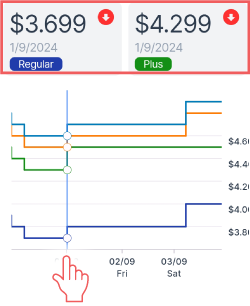
Price history for each fuel type.
Tap the graph to see the prices for each fuel type for that date.
Fuel Inventory report
The on-hand inventory (gallons) for each fuel type available at this location.
Competitors Fuel Prices report
See how the station's gas prices stack up against nearby competitors.
The report data comes directly from public third-party sources and is not reviewed by us. While we strive for accuracy, we cannot guarantee it is always correct and up-to-date. For the most current pricing, consider checking competitor websites directly.
Rate the results or share your feedback to help us improve.
Loss Prevention Live Cameras report
Real-time videos from cameras installed at the location. This report also shows if all cameras are functioning properly.
Watching videos can use a significant amount of data. If you're on a limited plan, consider connecting to Wi-Fi first.
To view the videos, tap the play icon in the center of the widget. You can also enable autoplay to start playback immediately when you enter the Dashboard.
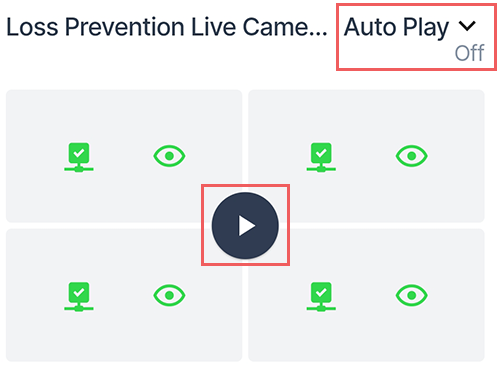
The widget shows live feeds from all your cameras (up to 4) simultaneously. Tap any tile to expand the video from a certain camera for a closer look.
If a camera is unavailable or the video stream cannot be loaded, the connection and view icons for the corresponding camera will be displayed in red.
Prerequisites
- The loss prevention functionality is only available if you have the Loss Prevention Analytics subscription.
- Video Journal permission must be granted to the Retail 360 Mobile user.
Loss Prevention Sales report
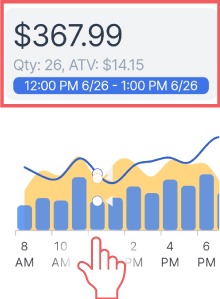
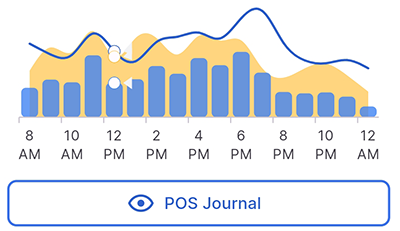
All cash register transactions for this location during the chosen timeframe.
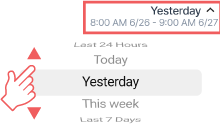
- Tap the dates interval in the top-right corner of the widget and scroll to the required period (from 1 day to 1 week)
- Tap the line on the graph to see the total cash register transactions for that timeframe.
- Tap POS Journal button to see the full list of transactions for the selected timeframe, the potential risk events associated with them, and the camera records (where available).
- Voids and cancels
- Refunds
- No-sale
- Discounts
- Direct department sales
- Age restricted sales
- Cash control
- Payments control
- FDA compliance
Prerequisites
- The loss prevention functionality is only available if you have the Loss Prevention Analytics subscription.
- To allow the Retail 360 Mobile user to access video records, grant Video Journal permission to that user in CStoreOffice®.

