


Loss Prevention Analytics collects information from cash register transaction logs (PJR files). For this reason, you need to have PJR file processing enabled for cash registers. For details, see Enabling PJR Files
Using Quick Filters
For Events Chronicles by Locations and Events Chronicles by Employees reports, Loss Prevention Analytics offers a set of presets, or quick filters. Quick filters are located in the left pane of the Loss Prevention Analytics window. You can click a specific quick filter to quickly get the necessary report data.

Loss Prevention Analytics offers the following quick filters:
| Preset Name | Preset Filtering Settings |
|---|---|
| Voids & Cancels | - MOP - Cash - Sale / Alert - Void in Sale - Sale / Alert - Void all Sale |
| Refunds | - MOP - Cash - Refunds - Itemized Refunds (item refunds) - Refunds - Non-itemized Refunds (department refunds) |
| No-Sale | Other - No-Sale |
| Discounts | - MOP - Cash - Sale / Alert - Discount |
| Direct Department Sales | - Sale / Alert - Direct Department Sales - Sale / Inside / Outside - Inside Sales |
| Age Restricted Sales Exceptions | Sale / Alert - Age Verification |
| Cash Control | - Financial - Safe Drop - Financial - Pay Out - Sale / MOP - Cash - Sale / Sum > $100 - Sale / Inside / Outside - Inside - Sales Fuel / Merch Sales - Merchandise |
| Payments Control | - Sale / Sum > $50 - MOP - Credits - Sale / Inside / Outside - Inside Sales - Fuel / Merch Sales - Merchandise |
| FDA Compliance | - MOP - Food Stamps - Sale / Inside / Outside - Inside - Sales Fuel / Merch Sales - Merchandise |
| No Event | No Event - enabled |
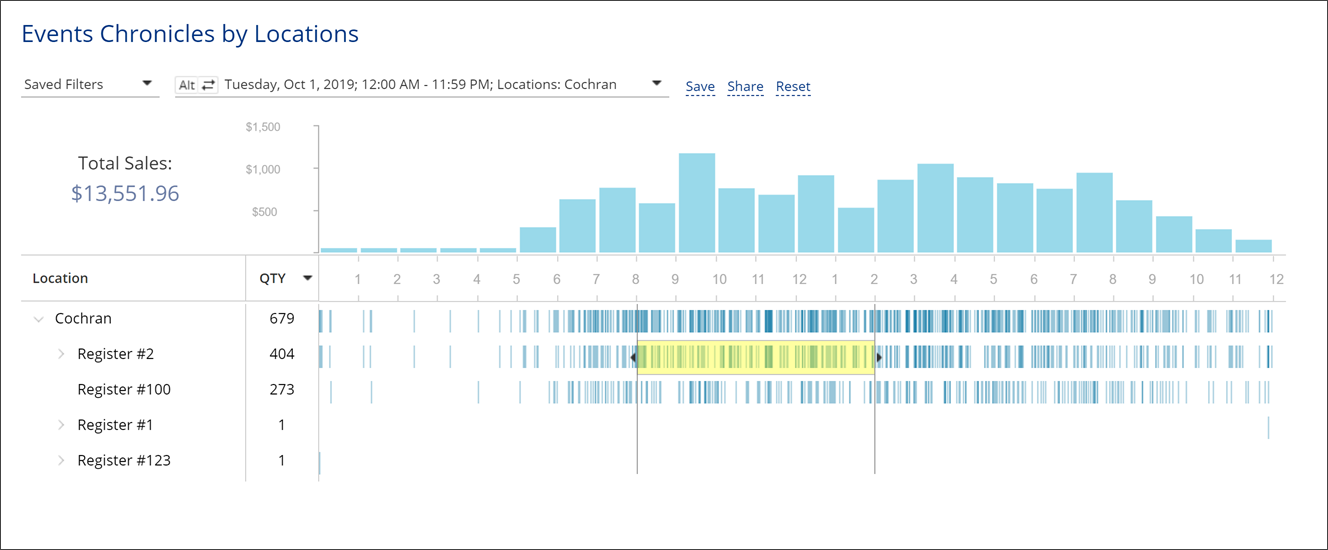
Events Chronicles by Location
The Events Chronicles by Locations report provides information on the sales instances for the selected 24-hour period and location(s).
For more details on how to apply report filters, see Working with Filters.
The report contains the following information:
- Total Sales: The total amount sold for the selected period and location(s) + sales tax.
- Events Chart: The chart displaying fluctuations of the events number and sales amount during the day.
- Location: Click to expand: Location > Cash Register/ Self-service device > Cashier.
- Quantity: The number of events for the location.
- Events: A graphic representation of the location events and sales using the bar chart on the timeline.
Sales Chronicles by Department
The Sales Chronicles by Department report provides information on the sales instances broken down by department for the selected 24-hour period and location(s).
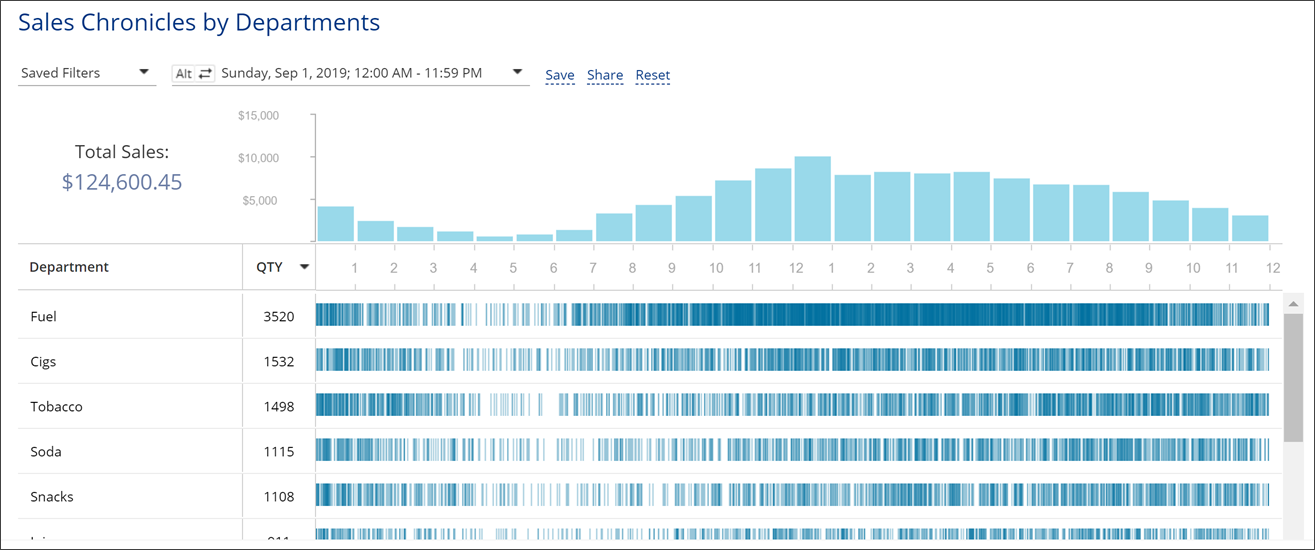
For more details on how to apply report filters, see Working with Filters.
The report contains the following information:
- Total Sales: The total amount sold for the selected period and location(s) + sales tax.
- Sales Chart: The chart displaying fluctuations of the sales amount during the day.
- Department: The cash register department.
- Quantity: The number of transactions for the department.
- Sales: A graphic representation of the location events and sales using the bar chart on the timeline.
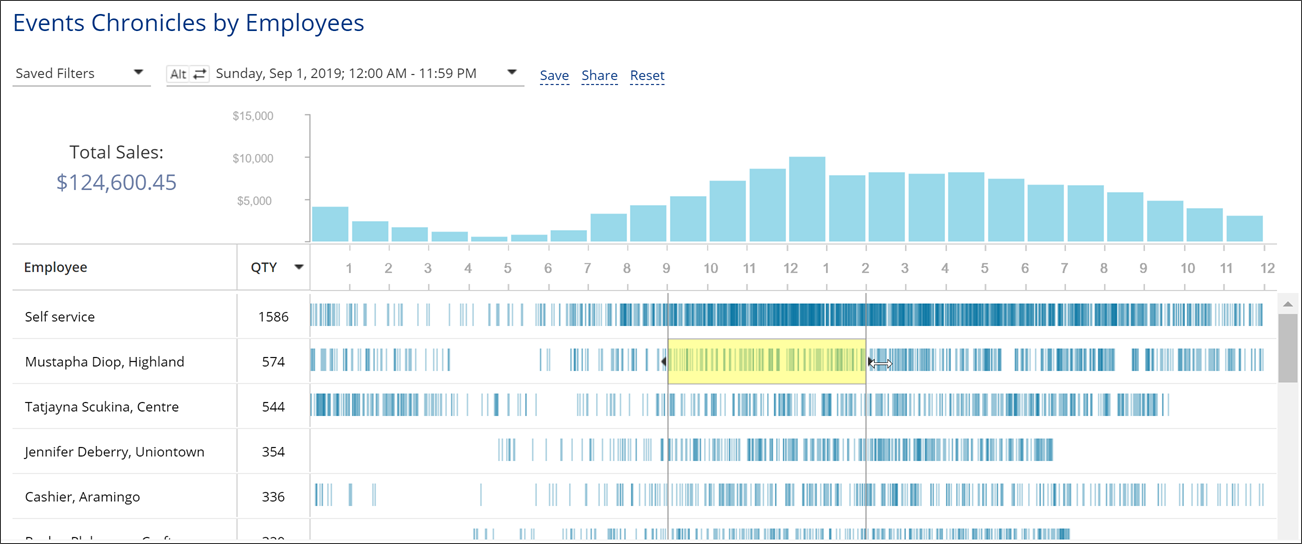
Events Chronicles by Employee
The Events Chronicles by Employees report provides information on the events and sales instances broken down by employees who performed the action for the selected time period and location(s).
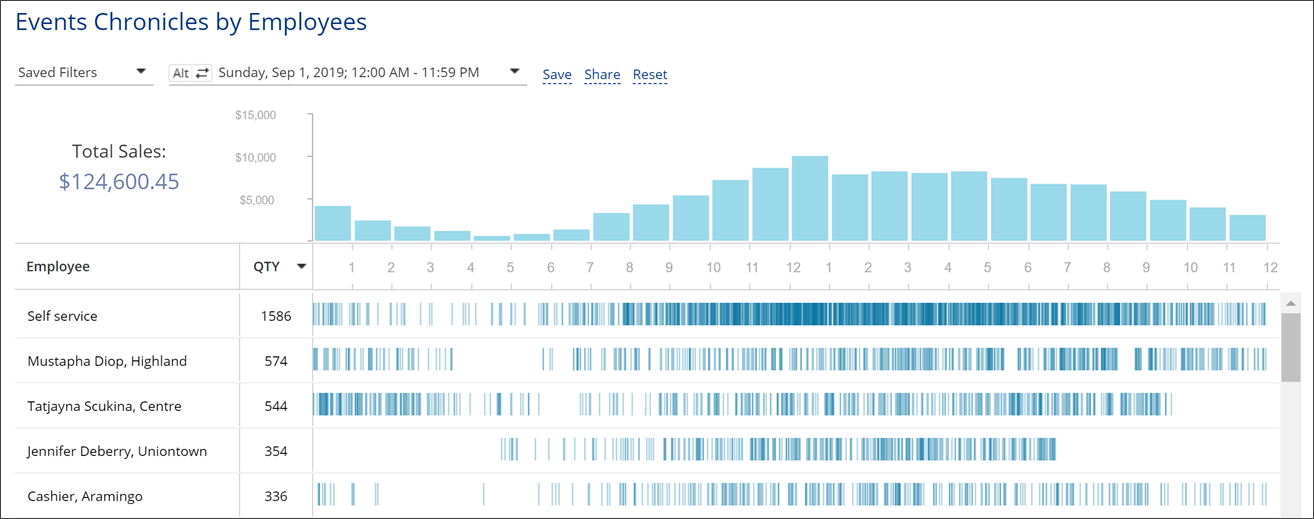
For more details on how to apply report filters, see Working with Filters.
The report contains the following information:
- Total Sales: The total amount sold for the selected period and location(s) + sales tax.
- Events Chart: The chart displaying fluctuations of the events number and sales amount during the day.
- Department: The cash register department.
- Quantity: The number of transactions for the department.
- Events: A graphic representation of the location events and sales using the bar chart on the timeline.
Drilling Down to Details of the Selected Period
While working with the Events and Sales Chronicles reports, you can drill down to details of a specific period:
- To view detailed information on a specific period, hover the cursor over the necessary period bar in the report chart.

- To view a specific period in the Video Journal interface, select the necessary period in the chart by placing the cursor to the period limit line and dragging the cursor right or left. You can also press and hold the CTRL key on the keyboard and use the arrow keys to select the necessary period. Once the period is selected, click it in the chart.

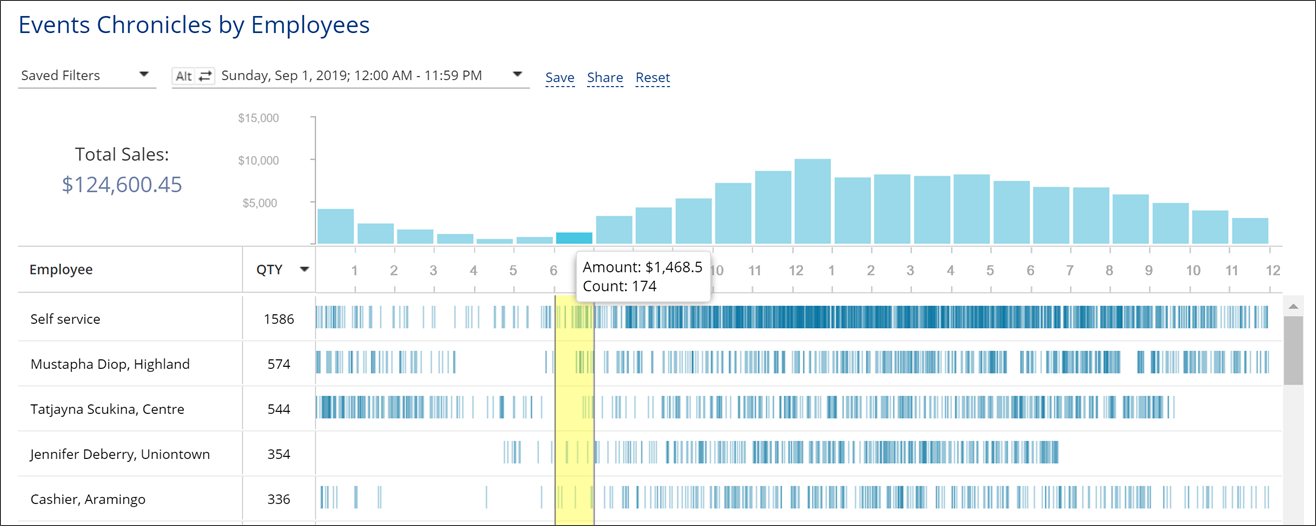
For details, see Viewing the Video Journal.


