


This section describes the specifics of accessing and interpreting the Station Performance report.
Opening the Report
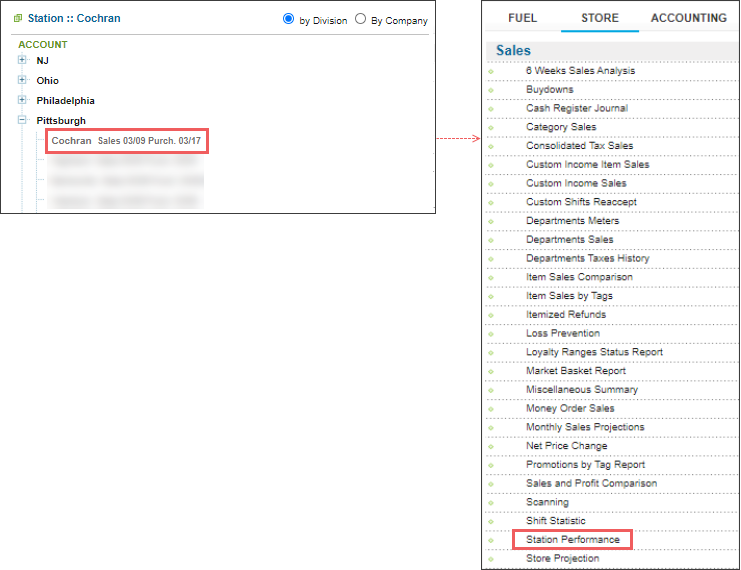
You can find the report at Reports > Store > Sales > Station Performance.
The report is available only at the location level. Before opening the report, in the list to the left of the reports list, select the location (station) you need:
For more information, see Viewing Reports.
Viewing the Report
The Station Performance report displays the information about key station's activity and sales data within the selected period, such as:
The report consists of the following data:
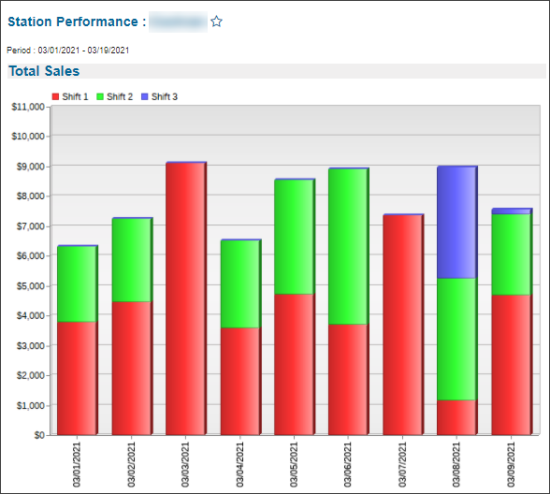
- Diagrams:
- Total Sales: Sales summary data by days.
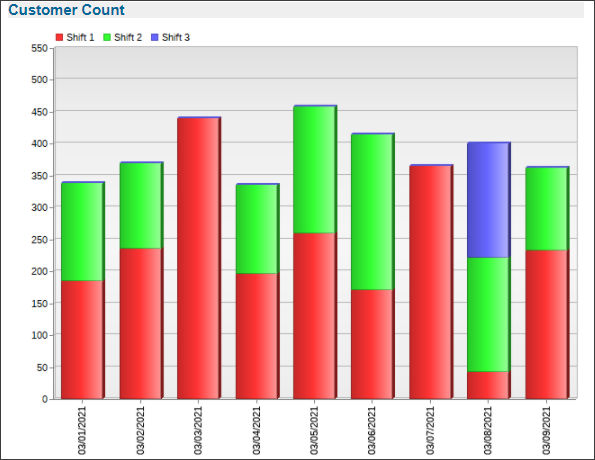
- Customer Count: The number of customers on the station within the specified period.

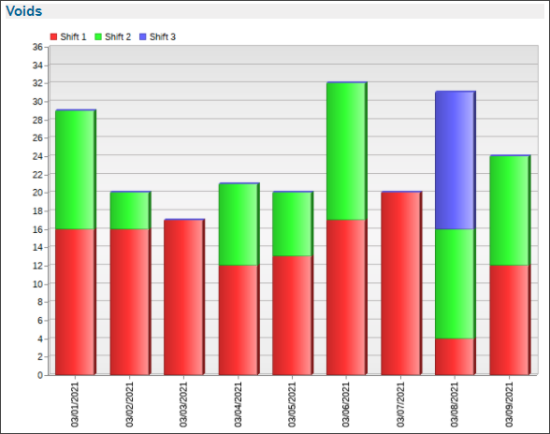
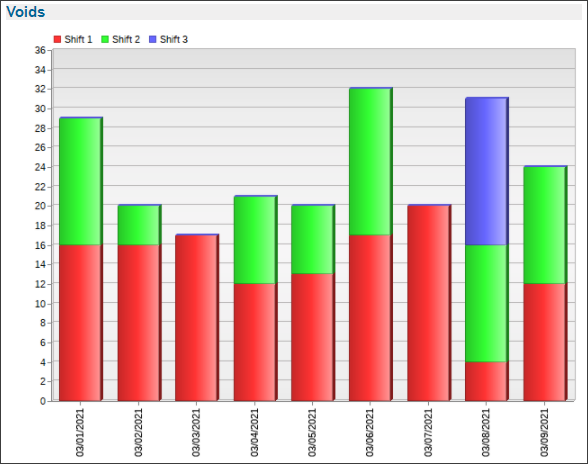
- Voids: The number of voided operations.
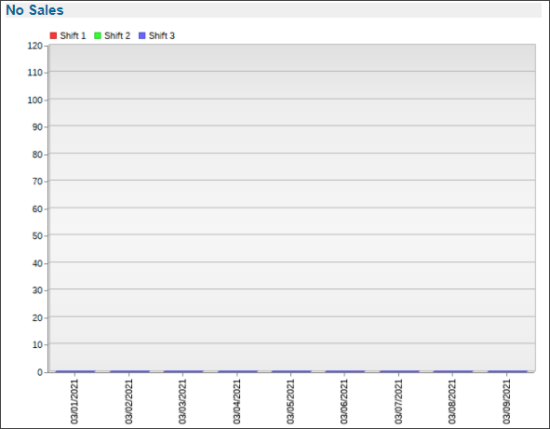
- No Sales
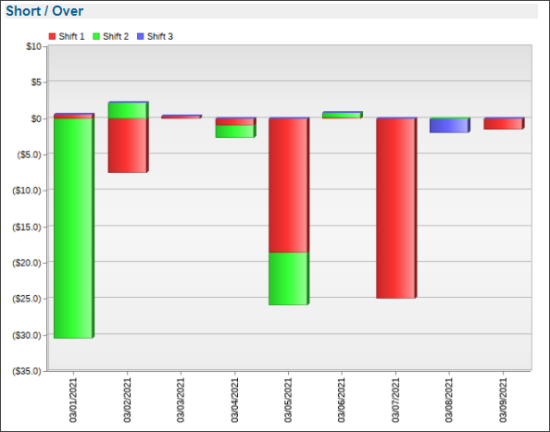
- Short / Over
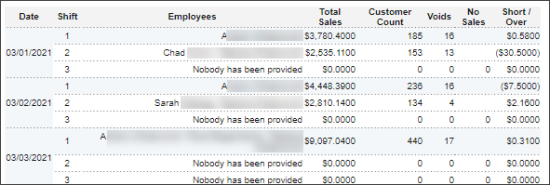
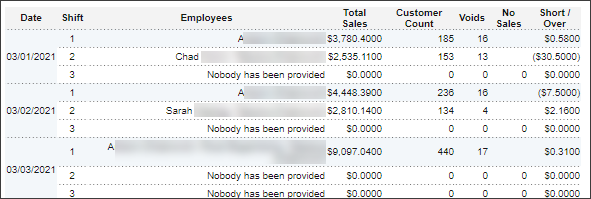
- Sales Data Table with the following data:
- Date
- Shift
- Employees
- Total Sales
- Customer Count
- Voids
- No Sales
- Short / Over


Filtering and Sorting Report Data
To get the exact information you need, you can apply filters to the report. To set up a filter, select one or more filtering options. Once the filter is set up, at the bottom of the filter section, click the Refresh button to display the report data by the filter criteria.
The report provides the following filtering options:
- Date. Specify the period you are interested in manually using the calendar or use one of the available filtering options, and then click Refresh There are the following filtering periods available:
- Custom Date
- Current Month
- Current Quarter
- Current Year
- Last Month
- Last Quarter
- Last Year
- Last 12 Months
- advanced. Click the advanced button and in the Filter By > Employee filter, select the employee and station you want to generate the report for.
For more information on additional report features, see Reports.


