


This section describes the specifics of accessing and interpreting the Sales and Profit Comparison report.
Opening Report
You can find the report at Reports > Store > Sales > Sales and Profit Comparison. For more information, see Viewing Reports.
Sales and profit comparison—How to access
This video presents the information on how to access Sales and Profit Comparison report.
Viewing Report
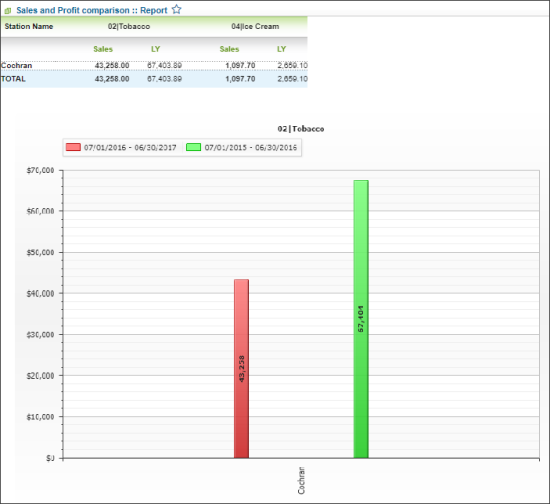
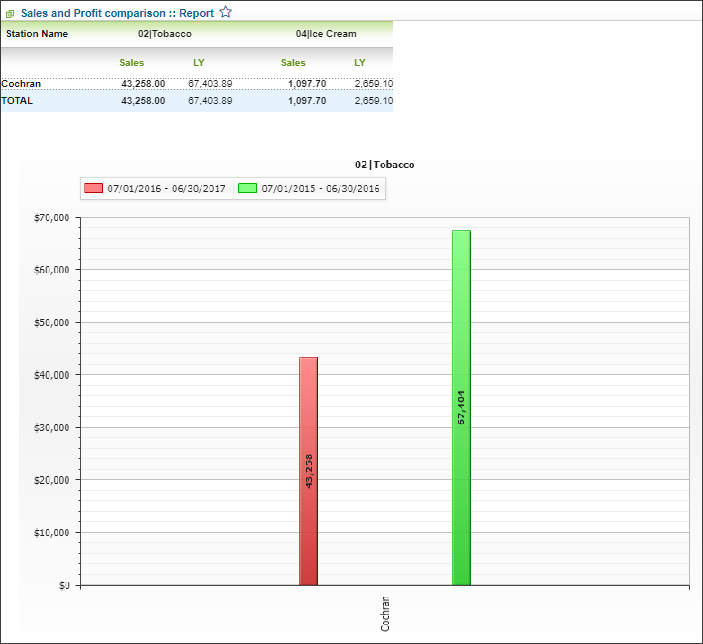
The Sales and Profit Comparison report displays the comparative sales and profit data grouped by the selected criteria within the selected month. Based on the report data, you can see, for example, how current sales compare to sales from the same period in the previous year per category.
The report contains the following information for each selected criteria:
- Sales: The sales data for the selected criteria
- LY: The sales data for the same period last year
For more information on additional report features, see Reports.
Filtering and Sorting Report Data
To get the exact information you need, you can apply filters to the report. To set up a filter, select one or more filtering options. Once the filter is set up, at the bottom of the filter section, click the Refresh button to display the report data by the filter criteria.
The report provides the following filtering and sorting options:
- Month and Year. Select a month and a year as the initial date for comparison.
- Periods. Select the periods range for comparison from the following possible values:
- Last 12 Months VS Previous 12 Months
- Last 3 Months VS Previous 3 Months
- Month VS Month
- Period VS Period
- Categories. Select the categories you want to view the report for.
- Price Groups. Select the price groups you want to view the report for.
- Promo Groups. Select the promo groups you want to view the report for.
- Stations Included. Select the stations you want to view the report for.
- Report By. Select one of the following criteria for grouping the report data:
- Categories
- Price Groups
- Promo Groups
- Report Type. Select the type of the report data to be displayed: Sales or Profit.
Press CTRL to select several items at a time.
Additional Actions
To open the Item Sales by Tags report for the selected criteria and period, in the diagram of this criterion, click the graph for the period you are interested in.


