This section describes the specifics of accessing and interpreting the Market Basket report.
Opening the Report
You can find the report at Reports > Store > Sales > Market Basket Report.
The report is available only at the location level. Before opening the report, in the list to the left of the reports list, select the location (station) you need:

For more information, see Viewing Reports.
Viewing the Report
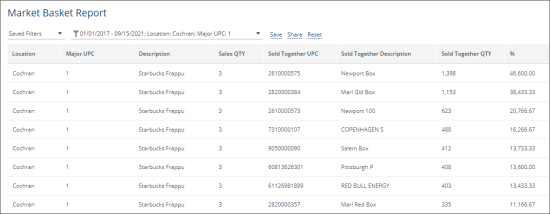
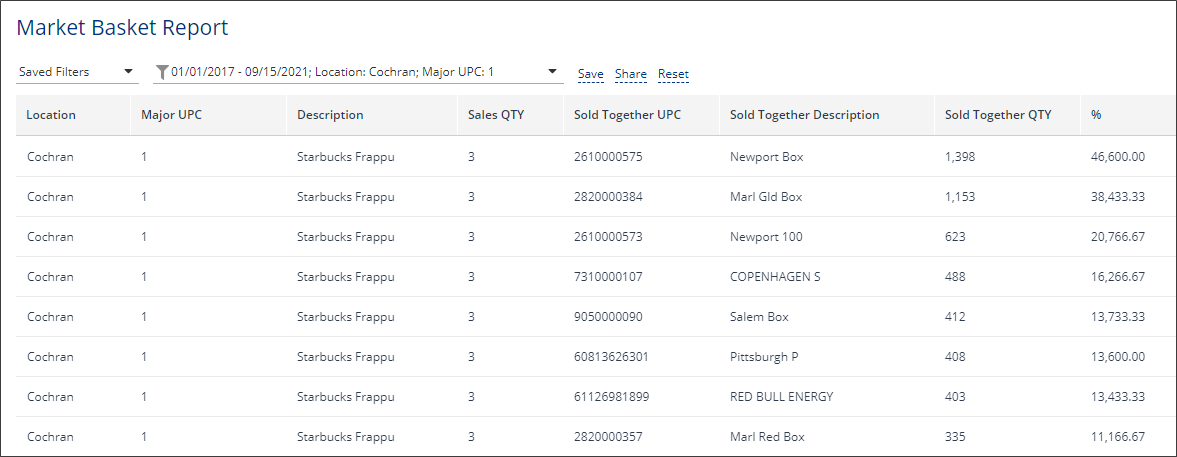
The Market Basket report displays the sales transactions for all items sold together at the selected location within the specified period. The report is implemented only for internal use and available only for the Greyhound account.
The report displays the following data:
- Location: The name of the location for which the report data is displayed.
- Major UPC: The item's UPC for which the report is generated. It is set up in the Major UPC filter.
- Description: The major item's description.
- Sales QTY: The amount of sales of items sold together.
- Sold Together UPC: The UPC of the item sold together with the major item.
- Sold Together Description: The description of the item sold together with the major item.
- Sold Together QTY: The quantity of items sold together in the transaction.
- %: The ration between the percent of the related items sales vs. the total sales amount. This value is calculated by the following formula: % = Sold Together QTY / Sales QTY * 100%.
Filtering and Sorting the Report's Data
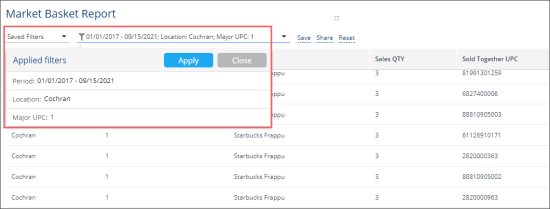
You can filter the report data by the following criteria:
- Period
- Location
- Major UPC
To filter the report data:
- At the top right of the report's table, click the filter icon.
- Select needed values in the criteria you need.
- Click Apply.