


This section describes the specifics of accessing and interpreting the Category Sales report.
Opening the Report
You can find the report at Reports > Store > Sales > Category Sales. For more information, see Viewing Reports.
Viewing the Report
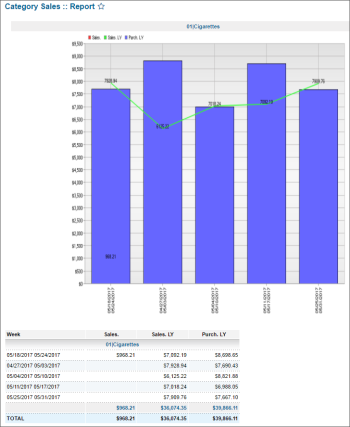
The Category Sales report provides advanced information on the purchases and sales of items for one or several selected categories during the specified period.
To view this report, filter by Item Tags or use subtotals.
The Category Sales report displays the following information:
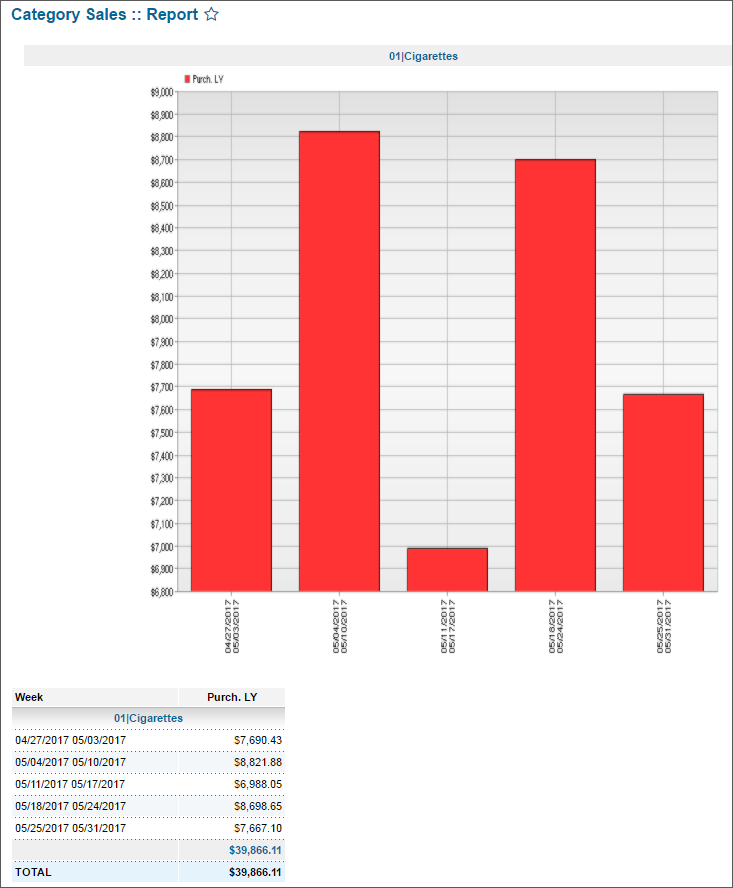
- Purchases: The Purchases diagram and table are displayed with the following data:
- Week.
- Purch: Purchases of items.
- Purch LY: Purchases of items for the last year.

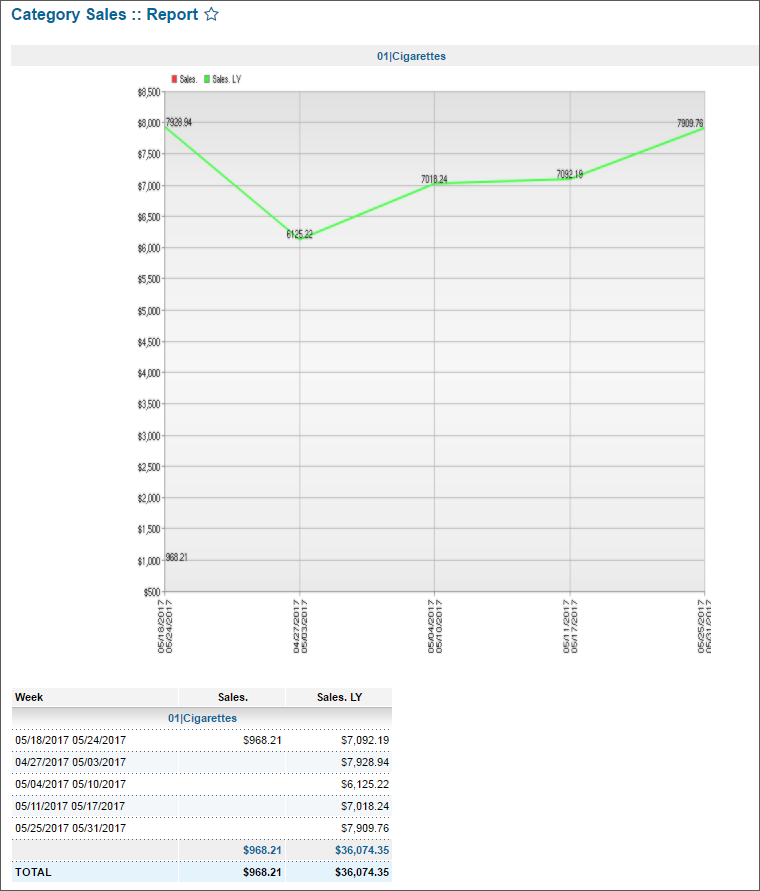
- Sales: The Sales diagram and table are displayed with the following data:
- Week
- Sales: Sales of items.
- Sales LY: Sales of items for the last year.

- Compare: The comparison diagram and table are displayed with the following data:
- Week
- Sales
- Purch.
- Sales LY.
- Purchases LY.

Viewing the Report Period
Please note that the Category Sales report displays data by week in order to provide the data which is relevant for comparison.
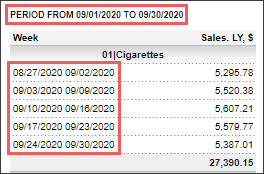
Each week in the report contains 7 days. The first week begins with the end of the period whereas the last week ends with the beginning of the period. If there are not enough days in the period to complete the last week, the required number of days is taken from the previous period.
For example, the report is generated for September 2020. The period from 01 September 2020 to 30 September 2020 will include the following weeks:
- Week 1: 08/27/2020 - 09/02/2020. In this week, 5 days from the previous period are taken to complete the week which should consists of 7 days.
- Week 2: 09/03/2020 - 09/09/2020
- Week 3: 09/10/2020 - 09/16/2020
- Week 4: 09/17/2020 - 09/23/2020
- Week 5: 09/24/2020 - 09/30/2020

For more information on additional report features, see Reports.
Filtering the Report Data
To get the exact information you need, you can apply filters to the report. To set up a filter, select one or more filtering options. Once the filter is set up, at the bottom of the filter section, click the Refresh button to display the report data by the filter criteria.
The report provides the following filtering options:
- Date. Specify the period you are interested in manually using the calendar or use one of the available filtering options, and then click Refresh There are the following filtering periods available:
- Custom Date
- Current Month
- Current Quarter
- Current Year
- Last Month
- Last Quarter
- Last Year
- Last 12 Months
- advanced. Click the advanced button, select one or several filtering options you want, and then click[ Refresh. There are the following advanced filtering options available:
- Filter By. Select one or several categories for the further breakdown of the results.
- Station Includes. Select the stations you want to view the report for.
- Show. Select Purchases, Sales, or Compare to view the purchases or sales of items or to view both.
The report displays its data by weeks, no matter what period is selected. For details, see Viewing the Report Period.
Press CTRL, to select several items at a time.
Select the Show Only option to view only the information for the selected items, and Show All Except to view the information for all the items except the selected ones.


