


This section describes the specifics of accessing and interpreting the Store Purchases Comparison report.
Opening Report
You can find the report at Reports > Store > Merchandise > Deliveries and Invoices. For more information, see Viewing Reports.
Viewing Report
You can use the Store Purchases Comparison report to view the purchases comparison information for a given location, company or division. The report allows you to learn how you are doing, for example, this year in comparison with the previous year, or check the purchases for one location against another location.
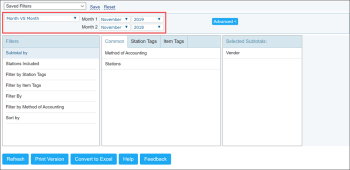
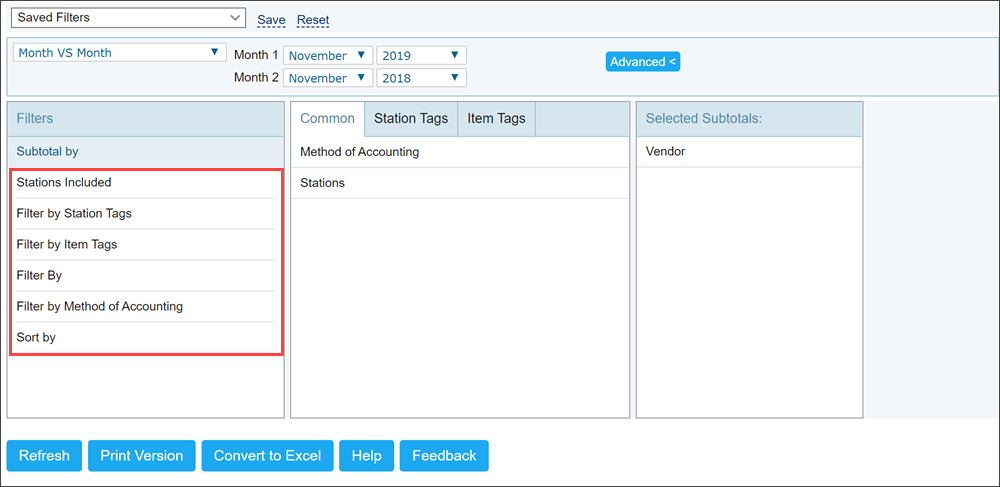
The report offers the advanced filter that will help you get the comparison data you need. You can create a comparison view by the following criteria:
- Period-over-period: You can select against which period you want to compare purchases for a specific location, for example, year-over-year, quarter-over-quarter or month-over-month.
- Versus other stations: You can compare purchases information for a specific location against another location.
- All stations average: You can view the purchases average for all locations for a specific period of time.
To view this report:
- Select by which criteria you want to create the comparison view.
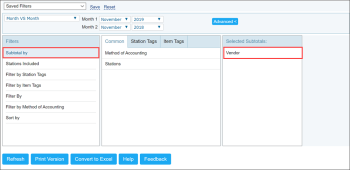
- Set the Subtotal by filter. You can filter the report data by common criteria, such as method of accounting, locations and vendors, specific station tags or item tags.
- (Optional) Refine your report further by using other filtering options. For details, see Filtering and Sorting Report Data.
- Click Refresh to get the report data according to the configured filter.

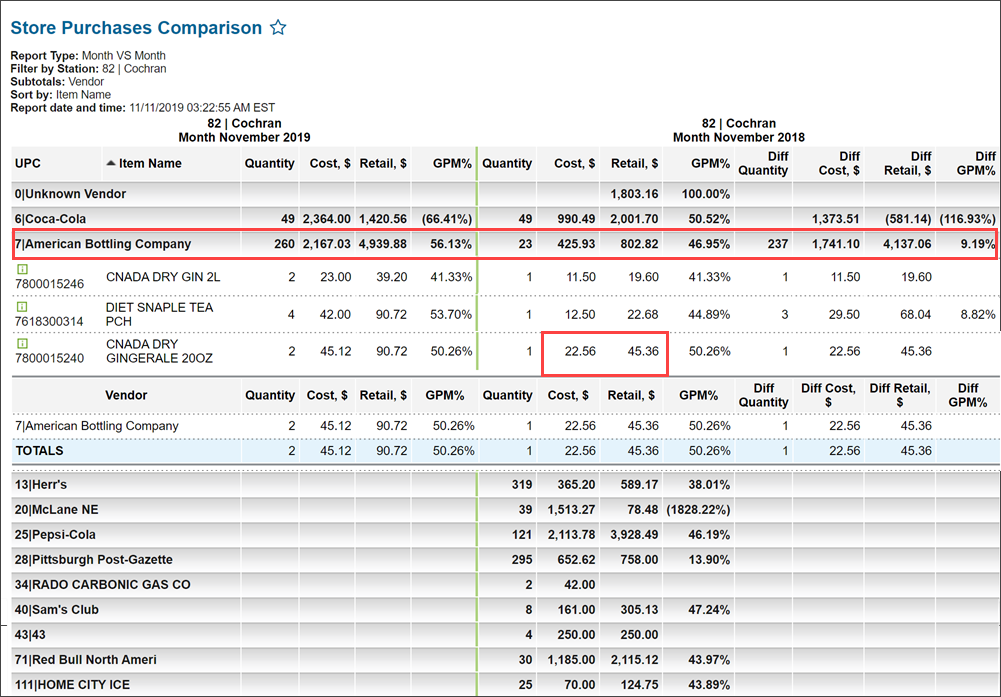
The report provides the following information:
- UPC: The UPC of the purchased item.
- Item Name: The name of the purchased item.
- Quantity: The quantity of the purchased item for each compared period or location.
- Cost: The cost for the purchases item for each compared period or location.
- Retail: The retail price for the purchased item for each compared period or location.
- GPM: The gross processing margin in percent for each compared period or location.
In addition, the report calculates the following difference values between the compared periods or locations:
- Diff Quantity: The difference between the purchased item quantities in dollars.
- Diff Cost: The difference between the purchased item costs in dollars.
- Diff Retail: The difference between the purchased item retail prices in dollars.
- Diff GPM: The difference between the gross processing margins in percent.
Data in the report is grouped by the filter criteria.
- To drill down in the reported criteria, for example, category or vendor, click the necessary row in the report.
- To view detailed cost and retail information for a specific item, click the Cost or Retail cell in the item row.
Filtering and Sorting Report Data
To get the exact information you need, you can apply filters to the report. To set up a filter, select one or more filtering options. Once the filter is set up, at the bottom of the filter section, click the Refresh button to display the report data by the filter criteria.
The report provides the following filtering and sorting options:
- Comparison filter: Select the criteria against which you want to compare data. You can select the following criteria:
- Last 12 Month VS Prev 12 Month
- Last 3 Month VS Prev 3 Month
- Period VS Period
- Month VS Month
- VS Other Stations
- All Stations Average
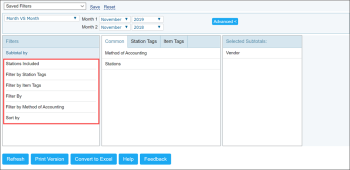
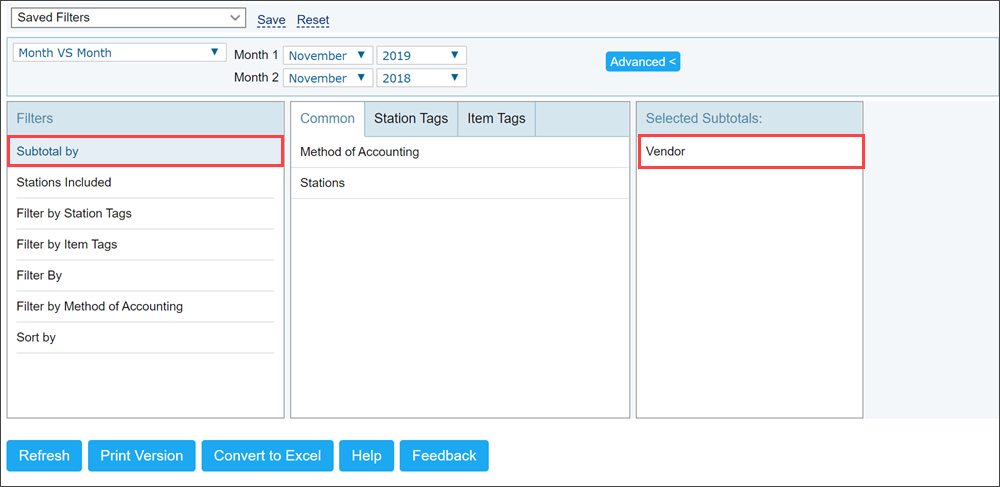
- advanced: Click the advanced button, select one several filtering options you want, and then click Refresh. There are the following advanced filtering options available:
- Subtotal By: Select one of the subtotal options - by Common (Method of Accounting, Station or Vendor), Station Tags or Item Tags if you want to break down the report results further.
- Station Included: Select the locations for which you want to view the report data.
- Filter by Station Tags: Use this option to filter the report data by tags assigned to stations. The generated report will contain data only for those stations to which the selected tags are assigned.
To select tags by which the report data must be filtered, expand the tags tree and select the check boxes next to the necessary tags. You can filter the report data by root tags and tags of the lower level in the tags hierarchy. You can also create a combined filter by selecting different root and child tags. - Filter by Item Tags: Use this option to filter the report data by tags assigned to items. The generated report will contain data only for those stations to which the selected tags are assigned.
To select tags by which the report data must be filtered, expand the tags tree and select the check boxes next to the necessary tags. You can filter the report data by root tags and tags of the lower level in the tags hierarchy. You can also create a combined filter by selecting different root and child tags. - Filter By Vendor: Select the vendor(s) by which you want to filter the report data.
- Filter by Method of Accounting: Select the method of accounting by which you want to filter the report data.
- Sort by: Select the order in which the report columns must be presented. Then select the Ascending or Descending option for the corresponding type of filtering.
Press CTRL to select several items at a time.
Select the Show Only option to view only the information for the selected items, and Show All Except to view the information for all the items except the selected ones.


