


This section describes the specifics of accessing and interpreting the Profit Contribution report.
Opening the Report
You can find the report at Reports > Store > Merchandise > GPM > Profit Contribution.
The Profit Contribution report can be opened at all levels:
- Account
- Company
- Division
- Location (Station)
For more information, see Viewing Reports.
Viewing the Report
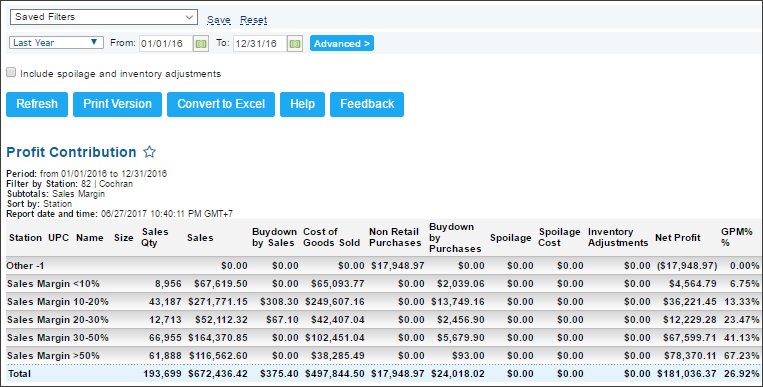
The Profit Contribution report provides advanced information on the profit contribution for the specified period.
Please note that the categories with the Don't Calculate GPM for This Category option selected are not included into this report. For more information, see Adding a New Category.
The report contains the following information:.
- Station
- UPC
- Name
- Size
- Sales quantity
- Sales amount
- Buydown by sales
- Cost of goods sold
- Non-retail purchases
- Buydown by purchases
- Spoilage
- Spoilage cost
- Inventory adjustments
- Net profit
- GPM
Filtering and Sorting the Report Data
To get the exact information you need, you can apply filters to the report. To set up a filter, select one or more filtering options. Once the filter is set up, at the bottom of the filter section, click the Refresh button to display the report data by the filter criteria.
The report provides the following filtering and sorting options:
- Custom Date. Specify the period you are interested in manually using the calendar or use one of the available filtering options, and then click Refresh There are the following filtering periods available:
- Yesterday
- Current Month
- Current Quarter
- Current Year
- Last Month
- Last Quarter
- Last Year
- Last 12 Months
- advanced. Click the advanced button, select one several filtering options you want, and then click[ Refresh. There are the following advanced filtering options available:
- Subtotal By. Select one of the subtotal options - by Common , Station Tags or Item Tags - if you want to break-down the report results further.
- Filter by Item Tags. Use this option to filter the report data by tags assigned to items. The generated report will contain data only for those items to which the selected tags are assigned.
To select tags by which the report data must be filtered, expand the tags tree and select the check boxes next to the necessary tags. You can filter the report data by root tags and tags of the lower level in the tags hierarchy. You can also create a combined filter by selecting different root and child tags. - Station Included. Select the stations you want to view the report for.
- Filter by Station Tags. Use this option to filter the report data by tags assigned to stations. The generated report will contain data only for those stations to which the selected tags are assigned.
To select tags by which the report data must be filtered, expand the tags tree and select the check boxes next to the necessary tags. You can filter the report data by root tags and tags of the lower level in the tags hierarchy. You can also create a combined filter by selecting different root and child tags. - Sort by. Select the order of the report columns you want. Select the Ascending or Descending option for the corresponding type of filtering.
Please note that the maximum custom period you can generate the report for is limited to last 12 months.
Press CTRL, to select several items at a time.
Select the Show Only option to view only the information for the selected items, and Show All Except to view the information for all the items except the selected ones.
To exclude the spoilage and inventory data from the report results, clear the corresponding option.
For more information on additional report features, see Reports.


