


This section describes the specifics of accessing and interpreting the GPM for Low Volume Stores report.
Opening Report
You can find the report at Reports > Store > Merchandise > GPM > GPM for Low Volume Stores. For more information, see Viewing Reports.
Viewing Report
The GPM for Low Volume Stores report can be used for stores with low volume sales and minimum purchases. In addition to data in other GMP reports that CStoreOffice® offers, this report provides additional information such as the beginning and ending inventory for stores, which allows you to assess the GPM % for such stores in a more accurate way.
To present information about stores, the GPM for Low Volume Stores report aggregates data from the following CStoreOffice® reports:
- Store GPM report
- Inventory Progress report
- Store Purchases report
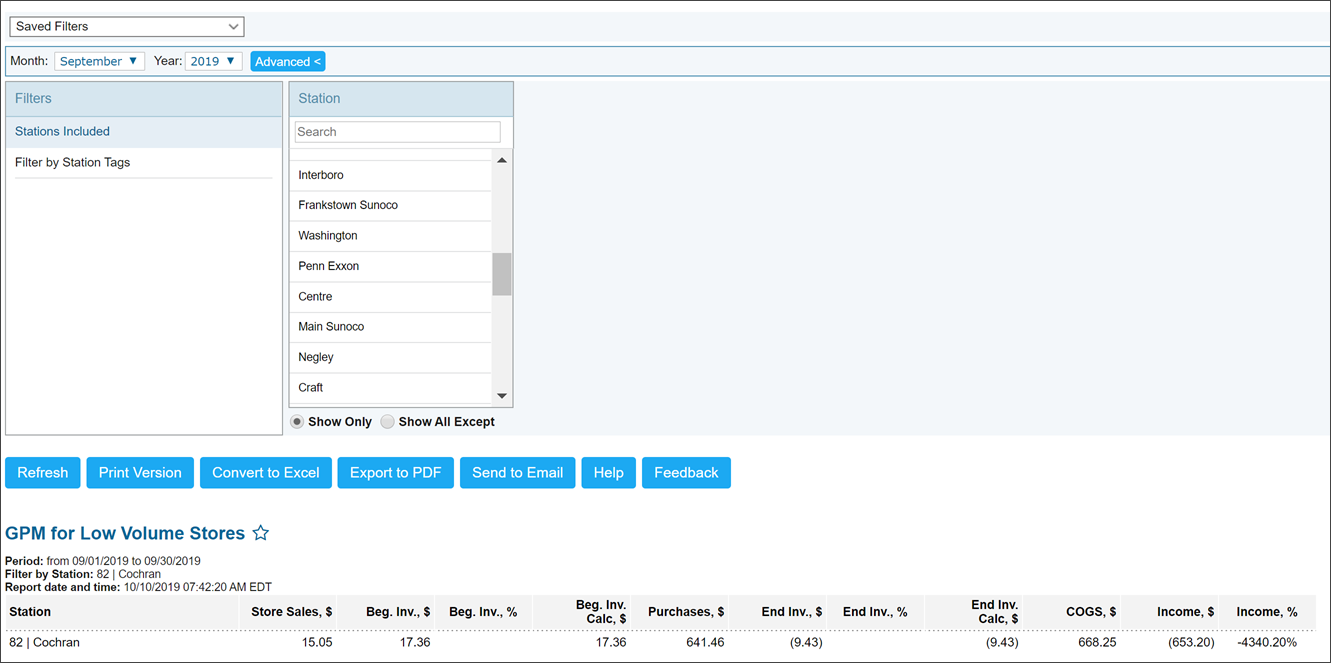
The report contains the following information:
- Station: The name of the location for which GMP data is reported.
- Store Sales, $: The total store sales amount for the month after buydowns and discounts.
- Beg. Inv., $: Open inventory for the first day of the month.
- Beg. Inv. %: The GPM on the first day of the month.
- Beg. Inv. Calc: Open inventory by purchases on the first day of the month. This value is calculated by the following formula: (Open Inventory * (1-GPM)).
- Purchases: Store purchases for the month.
- End. Inv., $: Close inventory for the last day of the month.
- End. Inv. %: The GPM on the last day of the month.
- End. Inv. Calc: Close inventory by purchases on the last day of the month. This value is calculated by the following formula: (Open Inventory * (1-GPM)).
- COGS: Cost of goods sold. This value in the report is calculated by the following formula: (Begin inventory + Purchases - End Inventory).
- Income $: The store income, or store sales.
- Income %: Store sales, COGS.
For more information on how the item cost is calculated, see Item Cost Calculation.
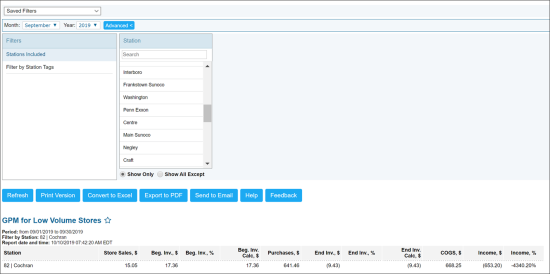
Filtering Report Data
To get the exact information you need, you can apply filters to the report. To set up a filter, select one or more filtering options. Once the filter is set up, at the bottom of the filter section, click the Refresh button to display the report data by the filter criteria.
The report provides the following filtering options:
- Date: Select the necessary month and year and then click Refresh.
- advanced. Click advanced, select one several filtering options you want, and then click Refresh. There are the following advanced filtering options available:
- Stations Included: Select the locations for which you want to view the report. At the bottom of the pane, select Show only to show data only for the selected locations, or Show All Except to show data for all locations except the selected one.
To select several items at a time, press CTRL or Shift on the keyboard.
- Filter by Station Tags: Use this option to filter the report data by tags assigned to locations. The generated report will contain data only for those locations to which the selected tags are assigned.
To select tags by which the report data must be filtered, expand the tags tree and select the check boxes next to the necessary tags. You can filter the report data by root tags and tags of the lower level in the tag hierarchy. You can also create a combined filter by selecting different root and child tags.
For more information on additional report features, see Reports.


