


This section describes the specifics of accessing and interpreting the GPM Explanation report.
Opening the Report
You can find the report at Reports > Store > Merchandise > GPM > GPM Explanation.
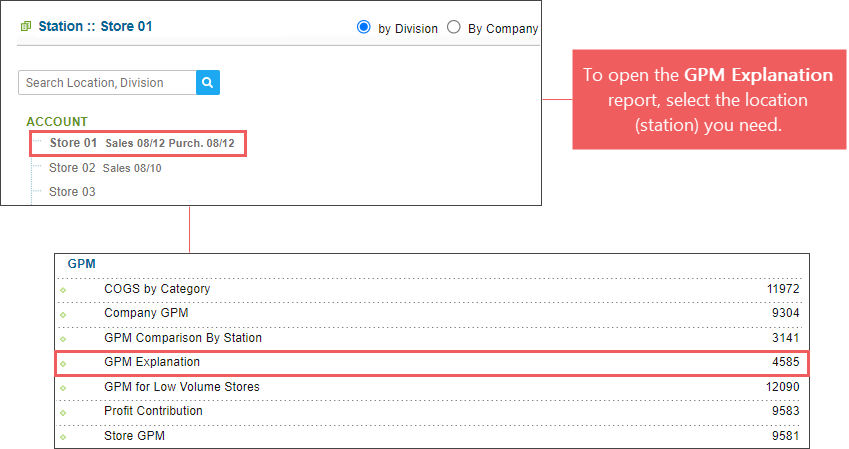
The report can be opened only at the location (station) level. Before opening the report, in the list to the left of the reports list, select the location (station) you need:
For more information, see Viewing Reports.
Viewing the Report
The GPM Explanation report is the best report to investigate margin issues by category as it includes all factors related to GPM. The report provides advanced information on the Gross Profit Margin for the specified groups of items for the specified period. This report is also based on 30 days worth of purchases.
The report contains the following information:
- Cost: Cost of the selected groups of items.
- Retail: Retail for the selected groups of items.
- GPM%: GPM percentage for the selected groups of items. For each row in the report, the GPM% value is calculated based on the following formulas:
- Store last 30 days purchases: GPM = (MaRetail – MaCost) / MaCost. Click any value in this row, to view the Store Purchases report.
- Buydown by Purchases: GPM = (MaRetail – MaCost – BuyDownsByPurchases) / MaRetail. Click any value in this row, to view the AR Buydown report.
- Price Change: GPM = (MaRetail + Inventory_Adj + PriceChange – MaCost) / (MaRetail + Inventory_Adj + PriceChange). Click any value in this row, to view the Price Change report.
- Write-Offs for the last 30 days: GPM = (MaRetail – MaCost – WriteOff + PriceChange) / (MaRetail – WriteOff + PriceChange). Click any value in this row, to view the Write-Offs by Tags report.
- Adjustments: GPM calculation formula: GPM = (MaRetail – WriteOff + Inventory_Adjusment + PriceChange + Adjustments – MaCost) / (MaRetail – WriteOff + Inventory_Adjusment + PriceChange + Adjustments).
- Tickets Adjustments: GPM = (MaRetail – Spoilage + Inventory_Adjusment + PriceChange + Adjustments + TicketsAdjustments – MaCost) / (MaRetail – WriteOff + Inventory_Adjusment + PriceChange + Adjustments + TicketsAdjustments). Click any value in this row, to view the Item Shortage report.
In all the above formulas, the MaRetail value is equal to all retails of purchases performed within last 30 days, MaCost value is equal to all costs of purchases within last 30 days.
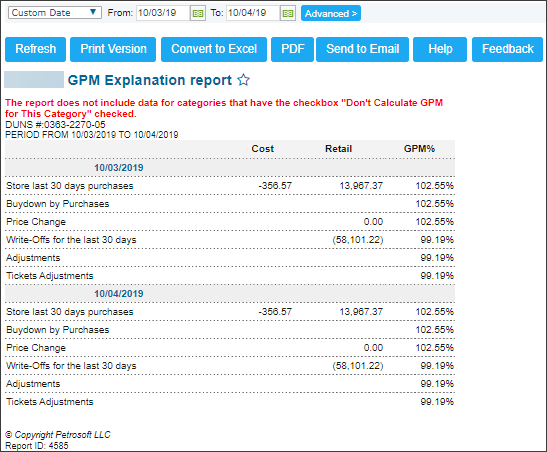
GPM is not calculated or equals to zero in the report in the following cases:
- For the categories that have the check-box Don't Calculate GPM for This Category selected.
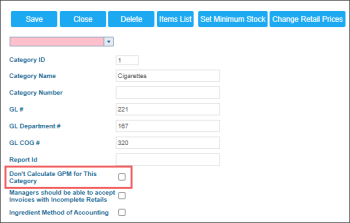
For details, see Category.
- There were no purchases made during the last 30 days.

Filtering the Report Data
To get the exact information you need, you can apply filters to the report. To set up a filter, select one or more filtering options. Once the filter is set up, at the bottom of the filter section, click the Refresh button to display the report data by the filter criteria.
The report provides the following filtering options:
- Date. Specify the period you are interested in manually using the calendar or use one of the available filtering options, and then click Refresh There are the following filtering periods available:
- Yesterday
- Current Month
- Current Quarter
- Current Year
- Last Month
- Last Quarter
- Last Year
- advanced. Click the advanced button, select one several filtering options you want, and then click[ Refresh. There are the following advanced filtering options available:
- Filter By. Select one or several filtering options, Category , Price Group or Promo Group, if you want to break-down the report results further.
Press CTRL, to select several items at a time.
Select the Show Only option to view only the information for the selected items, and Show All Except to view the information for all the items except the selected ones.
For more information on additional report features, see Reports.


