


This section describes the specifics of accessing and interpreting the GPM Comparison by Station report.
Opening Report
You can find the report at Reports > Store > Merchandise > GPM > GPM Comparison by Station. For more information, see Viewing Reports.
Viewing Report
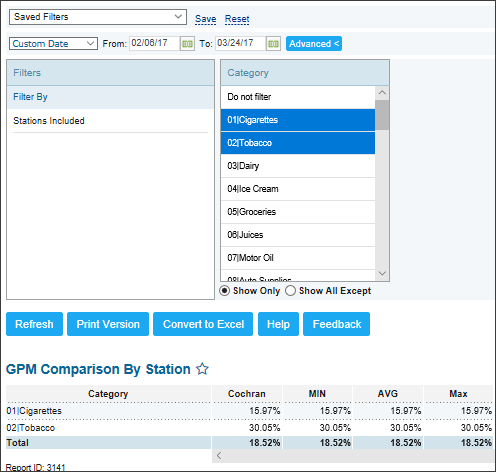
The GPM Comparison by station shows all locations within the account and what the GPM% for each category is per station.
In this report, you can view the following colors:
- Green: Indicates that the margin for this particular store and category is higher than the average.
- Red: Indicates that the margin is below the average.
- Black: Indicates normal margins.
If you need to investigate the data colored in red, click the red value and continue clicking the data inside until you get to specific items or promotions that are causing the issue. You may find negative margins through this method and make business decisions to correct it.
The report contains the following information:
- Category
- Station name
- MIN: Minimal GPM value for the station within the specified period.
- AVG: Average GPM value for the station within the specified period.
- Max: Maximum GPM value for the station within the specified period.
Filtering and Sorting Report Data
To get the exact information you need, you can apply filters to the report. To set up a filter, select one or more filtering options. Once the filter is set up, at the bottom of the filter section, click the Refresh button to display the report data by the filter criteria.
The report provides the following filtering and sorting options:
- Custom Date. Specify the period you are interested in manually using the calendar or use one of the available filtering options, and then click Refresh There are the following filtering periods available:
- Yesterday
- Current Month
- Current Quarter
- Current Year
- Last Month
- Last Quarter
- Last Year
- Last 12 Months
- advanced. Click the advanced button, select one several filtering options you want, and then click[ Refresh. There are the following advanced filtering options available:
- Filter By. Use this option to filter the report data by categories.
- Stations Included. Select the stations you want to view the report for.
Press CTRL to select several items at a time.
Select the Show Only option to view only the information for the selected items, and Show All Except to view the information for all the items except the selected ones.


