This section describes the specifics of accessing and interpreting the Stock Movement report.
Opening Report
You can find the report at Reports > Store > Inventory > Volume and state > Stock Movement. For more information, see Viewing Reports.
Viewing Report
The Stock Movement report provides detailed insights into the sales performance of various item types over the selected period.
Regardless of item type, the report only includes items with a non-zero on-hand quantity.
To generate the Stock Movement report:
- From the CStoreOffice® home page, click Reports > Store.
- Select the account, company, division, or station you need.
- In the Reports list > Store section, go to Inventory > Volume and State > Stock Movement.
- In the Stock Movement report:
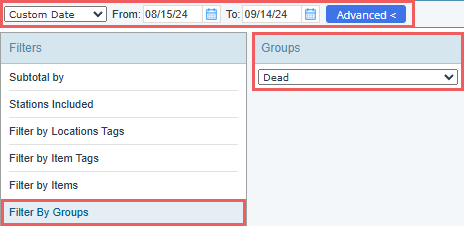
- Provide the date range used to track sales and purchases for aligning items with specific types. You can specify the beginning (From) and ending (To) dates or select one of the predefined date range from the dropdown:
- Yesterday;
- Current month: from the first day of the current month to the current date;
- Current quarter: from the first day of the current quarter to the current date;
- Current year: from the first day of the current year to the current date;
- Last month: from the first date to the last date of the previous month;
- Last quarter: from the first date to the last date of the previous quarter;
- Last year: from the January 1st of the previous year to the December 31 of the previous year;
- Last 12 months: from the first day of the month twelve months prior to the previous month till the last day of the previous month.
- If the Filters pane is not visible, click Advanced > to expand it.
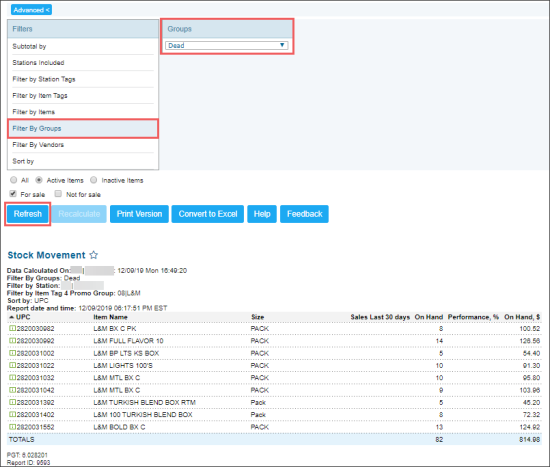
- Click Filter by Groups and select the type of items you want to generate the report for.
- Select other filtering options, if needed. For details, see Filtering and Sorting Report Data.
- Click the Refresh button.

By default, the report covers the past 30 days.
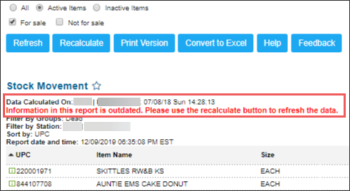
If the report data is outdated, "Information in this report is outdated." notification is displayed. To refresh the report data, click the Recalculate button and wait until the information to be updated for each station.
If the Recalculate button is disabled, the report data is up-to-date.
The report contains the following information:.
- UPC
- Item Name
- Size
- Sales Last 30 days
- On Hand (Quantity)
- Performance
- On Hand, $
Filtering and Sorting Report Data
To get the exact information you need, you can apply filters to the report. To set up a filter, select one or more filtering options. Once the filter is set up, at the bottom of the filter section, click the Refresh button to display the report data by the filter criteria.
The report provides the following filtering and sorting options:
- Click the Advanced > button, select one or several filtering options you want, and then click[ Refresh. There are the following advanced filtering options available:
- Subtotal By. Select one of the subtotal options - by Common (Stations and Vendors) or Item Tags - if you want to break-down the report results further.
- Filter by Station Tags. Use this option to filter the report data by tags assigned to stations. The generated report will contain data only for those stations to which the selected tags are assigned.
To select tags by which the report data must be filtered, expand the tags tree and select the check boxes next to the necessary tags. You can filter the report data by root tags and tags of the lower level in the tags hierarchy. You can also create a combined filter by selecting different root and child tags. - Filter by Item Tags. Use this option to filter the report data by tags assigned to items. The generated report will contain data only for those items to which the selected tags are assigned.
To select tags by which the report data must be filtered, expand the tags tree and select the check boxes next to the necessary tags. You can filter the report data by root tags and tags of the lower level in the tags hierarchy. You can also create a combined filter by selecting different root and child tags. - Filter by Items. Select this option and use the search tool to find the particular items you want to filter by.
- Filter by Groups. Select the item groups you want- new items, not sold, slow, normal, fast selling. This filter is required.
- Sort by. Select the order of the report columns you want. Select the Ascending or Descending option for the corresponding type of filtering.
- Active/Inactive. Select if you want to see all items, or active/inactive.
- For sale/Not for sale. Select if you want to see sale or non sale items.
Press CTRL, to select several items at a time.
Select the Show Only option to view only the information for the selected items, and Show All Except to view the information for all the items except the selected ones.
Item Types
- New items
Items added to the location within the last 15 days that have sold 5% or less of their on-hand quantity within the specified reporting period (default: 30 days). - Dead items
Items added to the location more than 15 days ago that had little to no sales or purchases (amounting to 5% or less of the on-hand quantity) within the specified reporting period (default: 30 days). - Slow items
Items with slow sales performance: sales quantity within the specified reporting period (default: 30 days) is less or equal to 50% of the on-hand amount. - Normal items
Items with normal sales performance: sales quantity within the specified reporting period (default: 30 days) is less or equal to 150% of the on-hand amount. - Fast selling items
Items with exceptional sales performance: sales quantity within the specified reporting period (default: 30 days) is more than 150% of the on-hand amount.
For an item to be considered dead stock, its inventory count before the last purchase must have been non-zero.
For more information on additional report features, see Reports.


