


This section describes the specifics of accessing and interpreting the Item Movement reports.
Opening the Report
You can find the report at Reports > Price Book > Movement > Item Movement. For more information, see Viewing Reports.
You can also open the Item Movement report in the following ways:
- Price Book > Dashboard > Items Updates > select a station > Item Movement.
- Price Book > Items > select an item > More Actions > Item Movement.
- Price Book > Items > select an item > More Actions > Item Info > click the Totals row in the bottom table.
- Price Book > Items > select an item > View > Related Information > Item Movement.
- Price Book > Price Groups > select a price group > View > Item Movement.
- Price Book > Promo Groups > select a promo group > View > Item Movement.
- Reports > Store > Inventory > Volume and state > Itemized Inventory by Tags > click the value you need in the Item Name column.
Item Movement Report's Permissions
The Item Movement report has the following permissions:
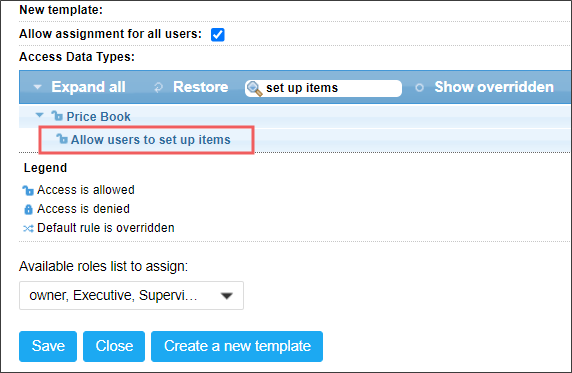
To view the report's data, grant the Allow users to set up items permission to the user.
The permission is located in the list of permissions at Price Book > Allow users to set up items.
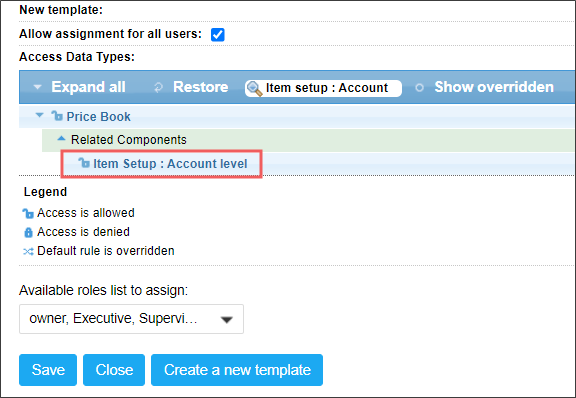
To view the report's data, grant the Item Setup : Account level permission to the user.
The permission is located in the list of permissions at Price Book > Related Components > Item Setup : Account level.
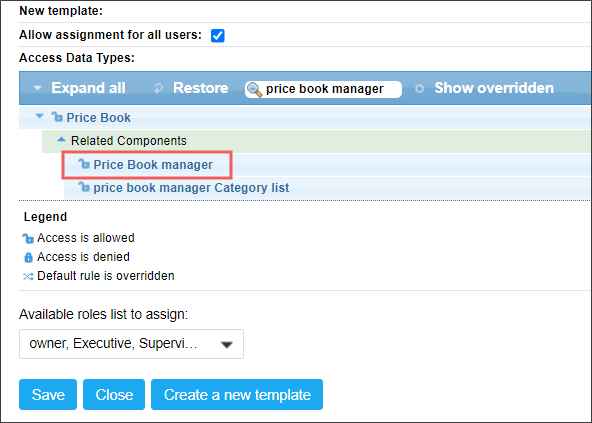
To filter the report's data by items and add items to the report, grant the Price Book manager permission to the user.
The permission is located in the list of permissions at Price Book > Related Components > Price Book manager.
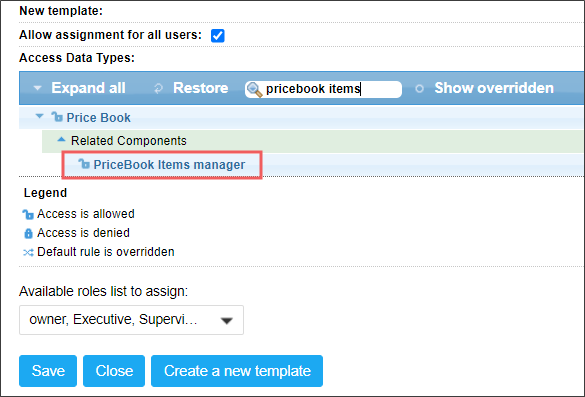
To filter the report's data by items and add items to the report, grant the PriceBook Items manager permission to the user.
The permission is located in the list of permissions at Price Book > Related Components > PriceBook Items manager.
For more information on how to grant a permission to the user, see Granting Role Permissions to Roles and Users.
Viewing the Report
The Item Movement report provides advanced information on the selected item or group of items sales, purchases, buydowns, and price changes over the specified period.
For optimal performance, especially with large price books, the Item Movement report is initially empty. Select the items (either individually or by tags) you are interested in from the Filters area and click the Refresh button to generate the report.
See Filtering and Sorting the Report Data for more information.
Sales
This section provides information on sales of the selected items grouped by stations and dates. Sales report is also accompanied by the diagram.
If the selected price book items have not been sold within the reporting period and the locations do not have these items in their inventory, the Sales section will not appear in the report.
On the station level, the aggregated sales statistics is displayed:
The location will only appear in the report if it has sales for the selected items or if its on-hand inventory for those items is greater than zero.
- Station: location / station name.
- Quantity: the total amount of the selected item(s) sold. If no sales occurred during the reported period, this value will be 0.
- On-hand amount of the selected item (only shown when a single item is selected).
- Sales performance of the selected item within the specified reporting period (only shown when a single item is selected):
- New: The item was added to the location within the last 15 days that was sold 5% or less of its on-hand quantity within the specified reporting period.
- Dead: The item was added to the location more than 15 days ago with little to no sales or purchases (amounting to 5% or less of the on-hand quantity) within the specified reporting period. The item's inventory count before the last purchase must be non-zero.
- Slow: The item's sales quantity within the specified reporting period is less or equal to 50% of the on-hand amount.
- Normal: The item's sales quantity within the specified reporting period is less or equal to 150% of the on-hand amount.
- Fast selling: The item's sales quantity within the specified reporting period is more than 150% of the on-hand amount.
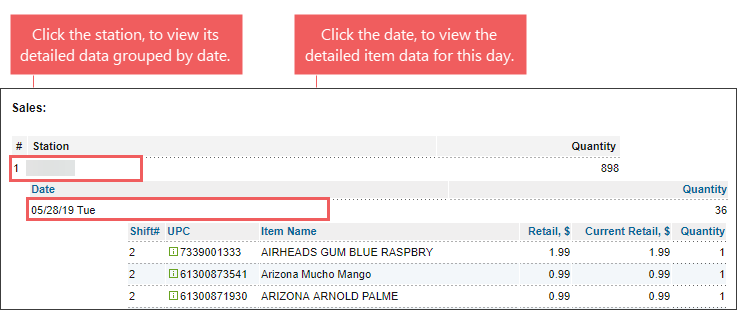
Click the location name to view its day-by-day sales statistics:
If a location has no sales during the reporting period, it will not be clickable.
- Date.
- Quantity: total amount of the selected item(s) sold for the date.
Click the date to view the detailed sales statistics for this date:
- Shift number.
- Item's UPC code.
- Item name.
- Retail price.
- Current retail price.
- Quantity: the amount of each item sold per shift.
Purchases
This section provides information on purchases of the selected items grouped by stations and dates. Purchases report is also accompanied by the diagram.
If the selected items have not been purchased within the specified period, you won't see the Purchases section in the report.
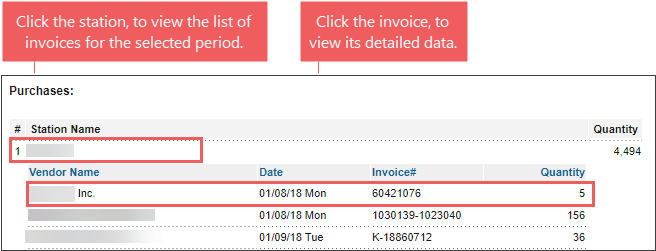
On the station level, the aggregated sales statistics is displayed:
- Station name.
- Quantity: total amount of the selected item(s) purchased.
Click the station name to view the day-by-day sales for this station:
- Date.
- Quantity: total amount of the selected item(s) purchased for the date.
Click the date to view the detailed sales statistics for this date:
- Vendor name.
- Purchase date.
- Invoice number.
- Quantity: the amount of each item purchased.
Buydown
This section provides information on buydowns of the selected items grouped by stations and dates.
On the station level, the aggregated buydown statistics is displayed:
- Station name.
- Quantity: total amount of the selected item(s).
Click the station name to view the day-by-day sales for this station:
- Date.
- Quantity: total amount of the selected item(s) buydowns for the date.
Click the date to view the detailed buydown statistics for this date.
PriceChange
This section provides information on price changes of the selected items grouped by stations, dates and shifts.
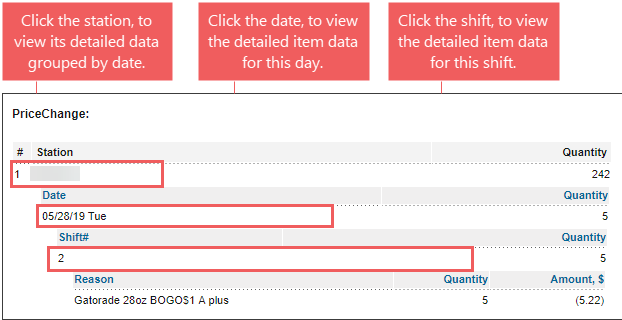
On the station level, the aggregated price changes information is displayed:
- Station name.
- Quantity: total amount of the selected item(s) for which the price was changed.
Click the station name to view the day-by-day price changes for this station:
- Date.
- Quantity: total amount of the selected item(s) for which the price was changed at the selected date.
Click the date to view the detailed shift statistics for this date:
- Shift number.
- Quantity: the amount of each item per shift.
Click the shift number to view the price changes for this shift:
- Promotion ID.
- Reason: promotion name.
- Quantity: the amount of the item for which the promotion is applied.
- Amount, $
Filtering and Sorting the Report Data
To get the exact information you need, you can apply filters to the report. To set up a filter, select one or more filtering options. Once the filter is set up, at the bottom of the filter section, click the Refresh button to display the report data by the filter criteria.
The report provides the following filtering and sorting options:
- Date. Specify the reporting period you are interested in. You can provide the beginning (From) and ending (To) dates or select one of the predefined date range from the dropdown:
- Yesterday; Current month: from the first day of the current month to the current date;
- Current quarter: from the first day of the current quarter to the current date;
- Current year: from the first day of the current year to the current date;
- Last month: from the first date to the last date of the previous month;
- Last quarter: from the first date to the last date of the previous quarter;
- Last year: from the January 1st of the previous year to the December 31 of the previous year;
- Last 12 months: from the first day of the month twelve months prior to the previous month till the last day of the previous month.
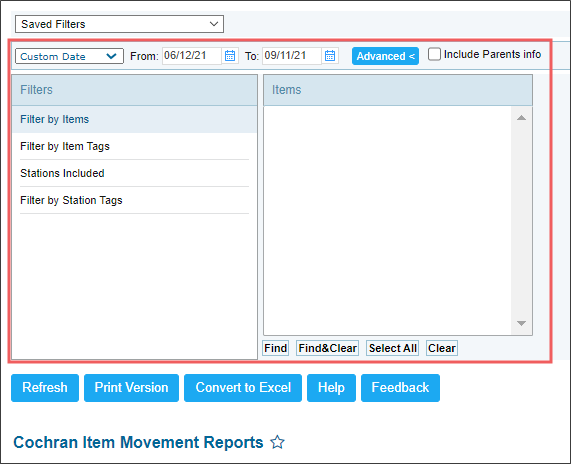
- Advanced. Click the Advanced > button, select one ore several filtering options you want, and then click Find. There are the following advanced filtering options available:
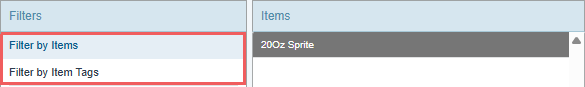
- Filter by Items: Select the item you want using the search.
- Filter by Item Tags: Use this option to filter the report data by tags assigned to items. The generated report will contain data only for those items to which the selected tags are assigned.
To select tags by which the report data must be filtered, expand the tags tree and select the check boxes next to the necessary tags. You can filter the report data by root tags and tags of the lower level in the tags hierarchy. You can also create a combined filter by selecting different root and child tags. - Station Included: Select this filtering option and specify the stations you are interested in.
- Filter by Station Tags: Use this option to filter the report data by tags assigned to stations. The generated report will contain data only for those stations to which the selected tags are assigned.
To select tags by which the report data must be filtered, expand the tags tree and select the check boxes next to the necessary tags. You can filter the report data by root tags and tags of the lower level in the tags hierarchy. You can also create a combined filter by selecting different root and child tags. - Include Parents info. Select this option to display the primary or parent items data.
Press CTRL, to select several items at a time.
Select the Show Only option to view only the information for the selected items, and Show All Except to view the information for all the items except the selected ones.
For more information on additional report features, see Reports.


