


This section describes the specifics of accessing and interpreting the Sales History report.
Opening Report
You can find the report at Reports > Fuel > Sales > Sales History. For more information, see Viewing Reports.
Viewing Report
Sales History report compares the station and competitors' fuel prices.
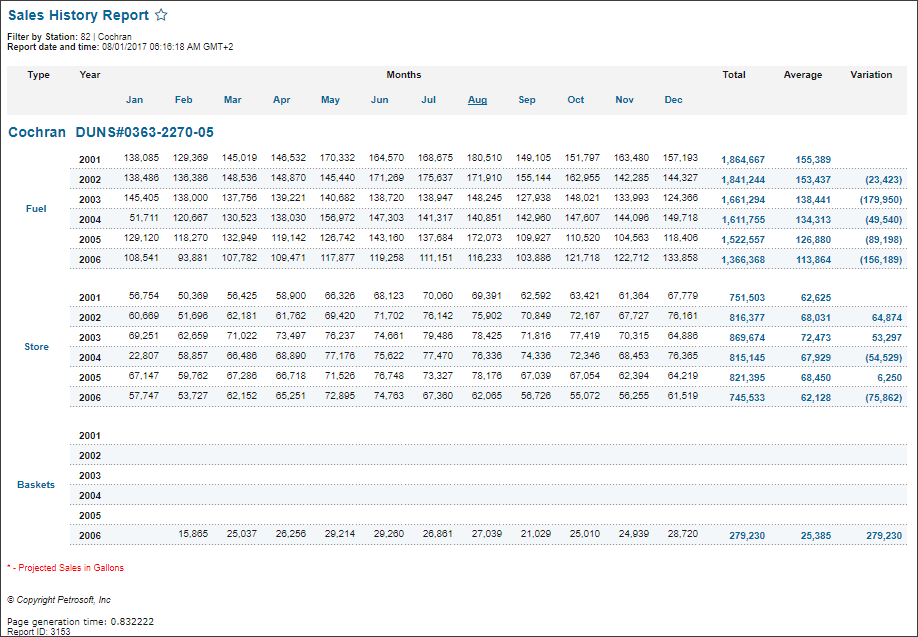
The report contains the following information:
- Type: The type of sales.
- Months: The sales data for each month.
- Total: Total amount for the year.
- Average: Average amount of sales or baskets for the year.
The average calculation formula: Average = Total / Number of Months. The Number of Months value is defined by the months with the store sales or baskets sales. - Variation +/-: The difference between the total amount for the previous year and for the current year.
The variation calculation formula: Variation = Total for Current Year - Total for Previous Year. If any month in the current or previous year has no data, both such months are not included into the total amount for the current or previous year. If there are no sales data for the previous year at all, the variation value for the current year is not displayed. -
In case the difference value is negative, it is displayed in brackets.
If there are store or basket sales only for the five months of the year, the average amount is calculated using the formula: Average = Total / 5.
In the report generated on 01 March 2019:
- Each month in the period from 01 January 2018 till 28 February 2019 has sales data.
- Each month in the period from 01 March 2019 till 31 December 2019 has no sales data.
The variation for 2019 (current year) in this case is calculated using the formula: Variation = (Total for January 2019 + Total for February 2019) - (Total for January 2018 + Total for February 2018).
Filtering Report Data
To get the exact information you need, you can apply filters to the report. To set up a filter, select one or more filtering options. Once the filter is set up, at the bottom of the filter section, click the Refresh button to display the report data by the filter criteria.
The report provides the following filtering options:
- Year. Select the year for which to display the data inclusively and then click Refresh.
- advanced. Click the advanced button, select one several filtering options you want, and then click Refresh. There are the following advanced filtering options available:
- Station Included. Select the stations you want to view the report for.
- Filter By Station Tags. Use this option to filter the report data by tags assigned to stations. The generated report will contain data only for those stations to which the selected tags are assigned.
To select tags by which the report data must be filtered, expand the tags tree and select the check boxes next to the necessary tags. You can filter the report data by root tags and tags of the lower level in the tags hierarchy. You can also create a combined filter by selecting different root and child tags.
Additional Actions
To view the detailed information on each sales type, click the value in the corresponding month column.
To show or hide budget on the report's sales types, click Show Budget or Hide Budget.


