


This section describes the specifics of accessing and interpreting the Daily Sales Comparison report.
Opening the Report
You can find the report at Reports > Fuel > Sales > Daily Sales Comparison.
The Daily Sales Comparison report can be opened at all levels:
- Account
- Company
- Division
- Location (Station)
For more information, see Viewing Reports.
Viewing the Report
The Daily Sales Comparison report compares the sales information from the same period last year.
The information is compared using the following categories:
- CY: Current year.
- LY: Last year.
- Diff: Difference calculated by the following formula: DIFF = CY - LY.
- % Diff: Difference percentage.
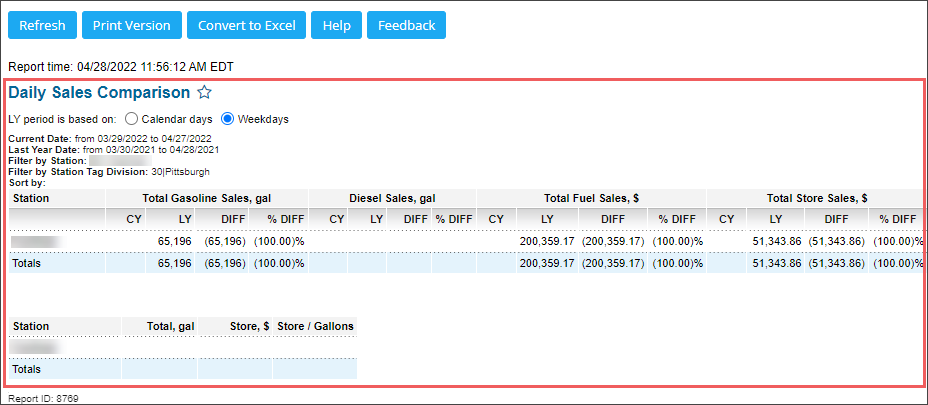
The report contains the following information:
- Report header:
- Current date: Displays the period selected for the report. For more information on how to define it, see Filtering and Sorting the Report Data.
- Last Year Date: Displays the period selected for the report, but for the last year. You can select the way the last year period is defined:
- Calendar days: Select this option if you need to define the last year period based on the same calendar days as those selected for the Current date period.
- Weekdays: This option is selected by default. When it is selected, the last year period based on the same weekdays as those selected for the Current date period. For example, with this option selected:
- If the Current date period = from 11/01/2021 to 11/30/2021, where 11/01/2021 is Monday and 11/30/2021 is Tuesday,
- The Last Year Date period = from 11/02/2020 to 12/01/2020, where: 11/02/2020 is Monday and 12/01/2020 is Tuesday. The same weekdays instead of calendar days are taken for the period. - Filter by: Filters applied to the report are displayed.
- Sort by: Sorting criteria applied to the report are displayed.
- Report table:
- Station
- Total Gasoline Gallon Sales
- Diesel Gallon Sales
- Total Fuel $ Sales: In this column, the report data is calculated by the following formulas:
- CY = Gasoline CY + Diesel CY + Kerosine CY
- LY = Gasoline LY + Diesel LY + Kerosine LY
- DIFF = CY - LY
- % DIFF = DIFF / LY * 100
- Total Store $ Sales: In this column, the report data is calculated by the following formulas:
- CY = grocery sales + grocery sales tax + store sales deli
- FY = grocery sales + grocery sales tax + store sales deli
- DIFF = CY - LY
- % DIFF = DIFF / LY * 100
- Totals: In this column, the report data is calculated by the following formulas:
- Total Galls = Gasoline CY + Diesel CY
- Store = Store CY
- Store / Gallons = Store / Total Galls
Filtering and Sorting the Report Data
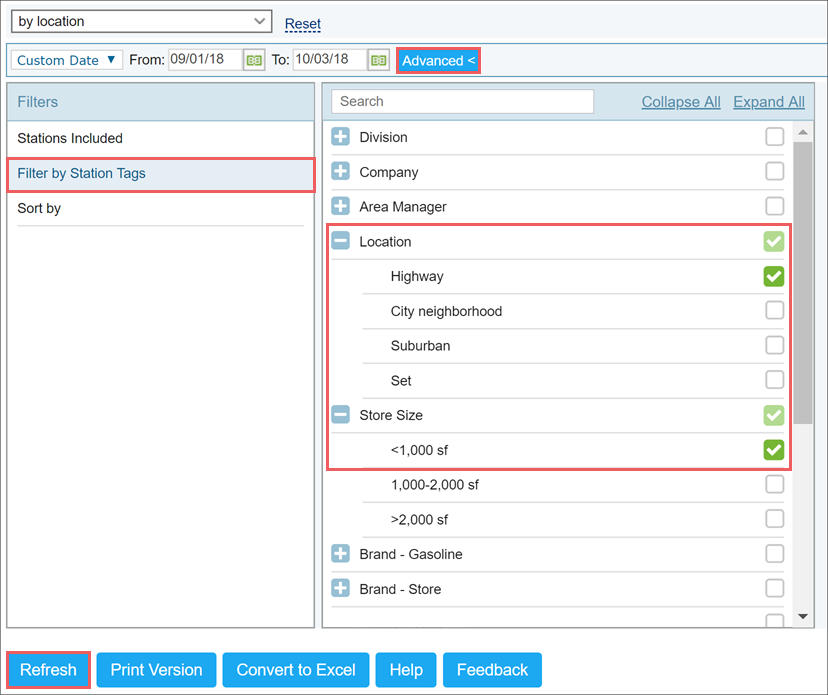
To get the exact information you need, you can apply filters to the report. To set up a filter, select one or more filtering options. Once the filter is set up, at the bottom of the filter section, click the Refresh button to display the report data by the filter criteria.
The report provides the following filtering and sorting options:
- Custom Date: This option is selected by default. Specify the period you are interested in using calendar.
- Daily: Select this option for the daily comparison.
- Weekly: Select this option for the weekly comparison.
- Monthly: Select this option for the monthly comparison.
- Quarterly: Select this option for the quarterly comparison.
In addition to the time interval filter, you can filter the report data by advanced criteria. To use the advanced filter, click the Advanced button and configure the filter using the following options:
- Stations Included: Select the stations for which you want to view the report.
- Filter By Location Tags: Use this option to filter the report data by tags assigned to stations (locations). The generated report will contain data only for those stations to which the selected tags are assigned.
To select tags by which the report data must be filtered, expand the tags tree and select the check boxes next to the necessary tags. You can filter the report data by root tags and tags of the lower level in the tags hierarchy. You can also create a combined filter by selecting different root and child tags. - Sort By: Use this option to sort the report data by report fields. Select the fields by which the report data must be sorted in the first and second turn and then select the order for displaying the data: Ascending or Descending.

You can perform the following operations with the configured filters:
- To save the filter, at the top of the filter section, click Save, specify the filter name and then click the tick icon on the right.
- To select a previously saved filter, in the Saved Filters list at the top of the filter section, select the necessary filter.
- To discard the filter, on the right of the Saved Filters list, click the Reset link.
Additional Actions
To reload the form, click Refresh.
To print the report, click Print Version.
To open the report the Microsoft Excel document, click Convert to Excel.
To open the Petrosoft University Portal, click Help.
To create a ticket, click Feedback.


