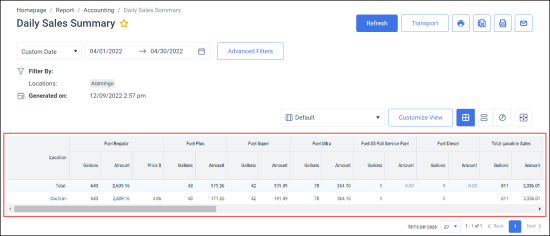
You can view the Daily Sales Summary report in the following three modes:
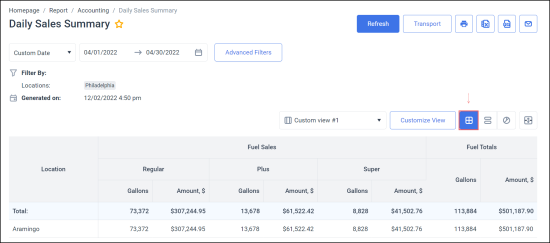
- In the Table mode: This mode is used by default, or you can switch to it by clicking the table icon.
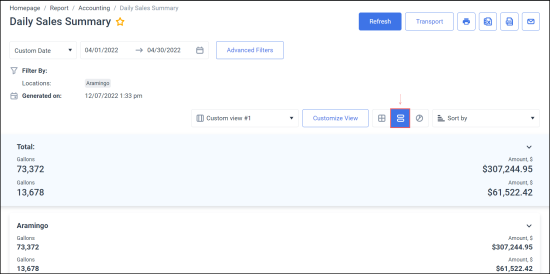
- In the Line mode: To switch to the Line mode and see the aggregate data, click the line icon.
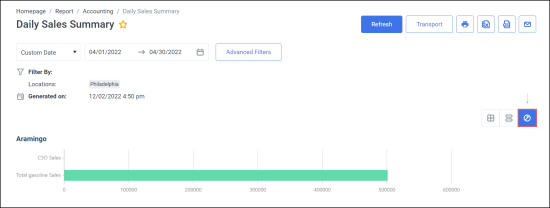
- In the Chart mode: To switch to the Chart mode, click the chart icon.
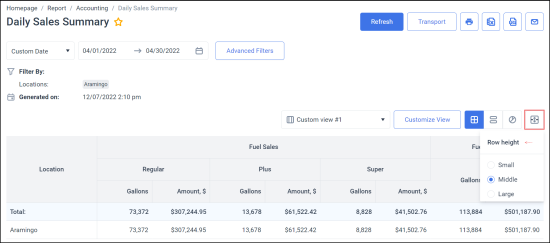
You can also adjust the height of table rows for a more comfortable view by clicking the Row height icon.
By default, the report contains the following information displayed in the Table mode:
- Location
- Sales data divided into the following sections:
- Fuel Sales by fuel types, including Gallons, Amount, and Price
- Total gasoline Sales
- Category Sales
- Lottery:
- Lottery
- Lottery Paid-Outs
- Net Lottery
- Totals:
- CSO Sales: CStoreOffice® sales data.
- CSO Tax: CStoreOffice® taxes data.
- Totals: Total sales data.
The default report can be customized using the following available data groups and metrics:
|
Data Group |
Metrics |
Filters |
Description |
|
Fuel Sales |
Gallons, Amount, $ Price, $ |
Fuel product, e.g.: Regular, Plus, Super etc. |
Sales numbers for each selected type of fuel product |
|
Fuel Totals |
Gallons, Amount, $ Price, $ |
- |
Combined sales for all fuel products |
|
Store Sales |
Amount, $ |
Department or Category, e.g. Snacks, Dairy etc. |
Sales numbers for each selected type of store department or category |
|
Lottery Sales |
Amount, $ |
Lottery Lottery Paid-Outs Net Lottery |
Sales numbers for each selected type of lottery options |
|
Store Totals |
Amount, $ |
- |
Combined sales for all store products. This does not include the lottery sales |
|
Store Tax |
Amount, $ |
- |
Combined tax amount for a store |
|
Totals |
Amount, $ |
- |
Combined amount for a location which includes Fuel totals, Store totals and Store tax |
|
Transaction QTY |
Count |
- |
Total number of transactions irrespective of selected filters |
| Totals by MOP | Amount, $ | Method of payment, e.g. credit card or cash | Combined sales for the selected methods of payment and the total sales for all selected MOPs. |
| Consignment | Amount, $ | - | The money a seller (consignor) receives from a store (consignee) after an item is sold on their behalf. It is determined by the final sale price and the agreed-upon split, with the store taking a commission for their services. |
For more details about customizing report views, see Managing Custom Views.
