


This section describes the specifics of accessing and interpreting the Consolidated Daily Deposit Report.
Opening Report
You can find the report at Reports > Accounting > Review Sales > Consolidated Daily Deposit. For more information, see Viewing Reports.
Viewing Report
The Consolidated Daily Deposit report provides the information on the deposit data including total cash and selected MOPs within the specified period.
The report contains the following information:
- Date
- Cash Deposit (+checks)
- Lottery Deposit
- Total Cash: The Total Cash value is calculated by the following formula: Total Cash = Cash Deposit (+checks) + Lottery Deposit.
- Selected MOP data: All base and custom MOPs selected in the MOP Type filter are displayed in the report.
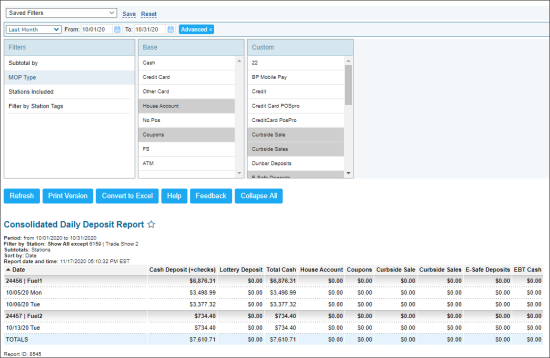

Filtering Report Data
To get the exact information you need, you can apply filters to the report. To set up a filter, select one or more filtering options. Once the filter is set up, at the bottom of the filter section, click the Refresh button to display the report data by the filter criteria.
The report provides the following filtering and sorting options:
- Custom Date: Select this filtering option and specify the period you are interested in, and then click Refresh. There are the following filtering periods available:
- Yesterday
- Current Month
- Current Quarter
- Current Year
- Last Month
- Last Quarter
- Last Year
- Last 12 Months
- Subtotal by: Select this filtering option and the subtotal option if you want to break-down the report results further.
- MOP Type: Select this filtering option and select any of the following MOPs to include their data into the report:
- Base
- Custom
- Stations Included: Select the locations for which you want to view the report.
- Filter by Station Tags: Use this option to filter the report data by tags assigned to stations. The generated report will contain data only for those stations to which the selected tags are assigned.
The Base and Custom MOPs filters contain only MOPs that are visible at least for one station on the account in the MOP Mapping form which is located at the Main Menu > Data Entry > Cash Reconciliation section. For more information on how to add or hide methods of payment in the MOP Mapping form, see MOP Mapping.
Press CTRL, to select several items at a time.
Additional Actions
To reload the form, click Refresh.
To print the report, click Print Version.
To view the report in the Excel version, click Convert to Excel.
To open the Petrosoft University Portal, click Help.
To create a ticket, click Feedback.
To expand all the report data, click Expand All.
To hide the expanded report data, click Collapse All.
To save the report to favorites, click the favorites icon next to the reports name.


