


Loss Prevention Analytics collects information from cash register transaction logs (PJR files). For this reason, you need to have PJR file processing enabled for cash registers. For details, see Enabling PJR Files.
Viewing Report Data
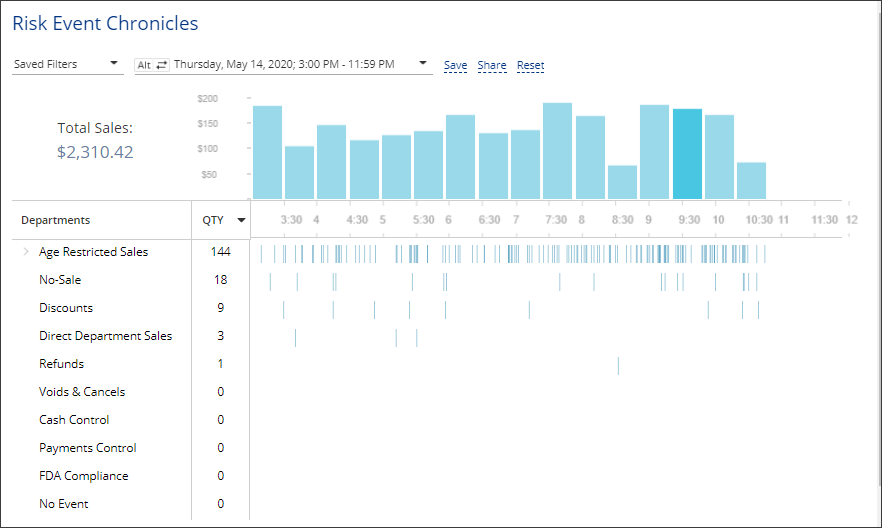
The report provides the following information:
| Name | Filtering Settings |
|---|---|
| Age Restricted Sales
(available only for Verifone CR) |
Alert - Age Verification: - Manual - Scanned - Skipped |
| Discounts | - MOP - Cash - Sale / Alert - Discount |
| Direct Department Sales | - Sale / Alert - Direct Department Sales
- Sale / Inside / Outside - Inside Sales |
| No-Sale | Other - No-Sale |
| Cash Control | - Financial - Safe Drop - Financial - Pay Out - Sale / MOP - Cash - Sale / Sum > $100 - Sale / Inside / Outside - Inside - Sales Fuel / Merch Sales - Merchandise |
| FDA Compliance | - MOP - Food Stamps - Sale / Inside / Outside - Inside - Sales Fuel / Merch Sales - Merchandise |
| Refunds | - MOP - Cash - Refunds - Itemized Refunds (item refunds) - Refunds - Non-itemized Refunds (department refunds) |
| Payments Control | - Sale / Sum > $50 - MOP - Credits - Sale / Inside / Outside - Inside Sales - Fuel / Merch Sales - Merchandise |
| Voids & Cancels | - MOP - Cash - Sale / Alert - Void in Sale - Sale / Alert - Void all Sale |
| No Event | No Event - enabled |
The report data is calculated with taxes.
Drilling Down to Details of the Selected Period
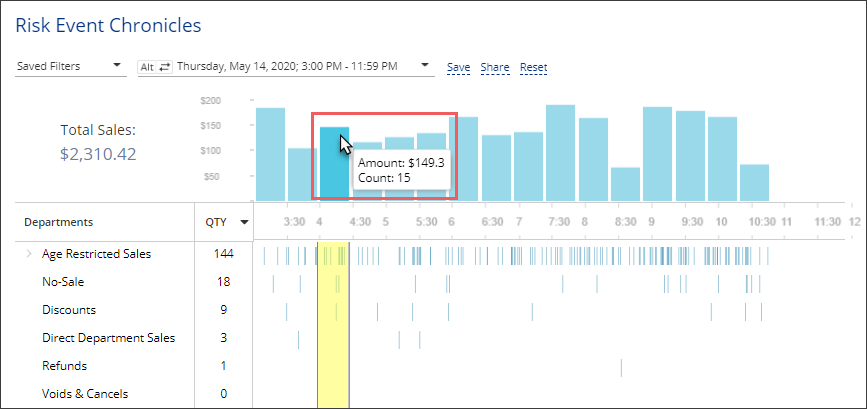
While working with the Risk Event Chronicles reports, you can drill down to details of a specific period:
- To view detailed information on a specific period, hover the cursor over the necessary period bar in the report chart.

- To view a specific period in the Video Journal interface, select the necessary period in the chart by placing the cursor to the period limit line and dragging the cursor right or left. You can also press and hold the CTRL key on the keyboard and use the arrow keys to select the necessary period. Once the period is selected, click it in the chart.
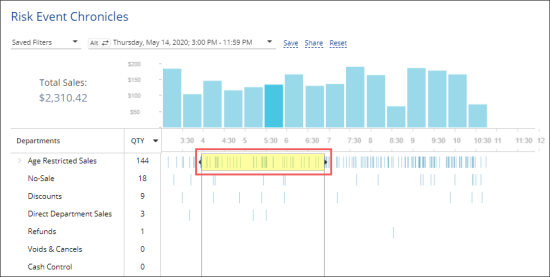

For details, see Viewing the Video Journal.


