


This section describes the specifics of accessing and interpreting the Gas Sales Comparison report.
Opening the Report
You can find the report at Reports > Fuel > Sales > Gas Sales Comparison.
The report is available only at the location level. By default, the report is opened for a current location, but you can select another location from the Station list in the Filters section.
For more information, see Viewing Reports.
Viewing the Report
The Gas Sales Comparison report allows you to compare the gasoline sales data using the following criteria:
- Fuel Type
- Comparison Type: Select the comparison criteria
To select multiple fuel products, hold down the Control key and click the items in the list.
- Last 12 months vs. previous 12 months
- Last 3 months vs. previous 3 months
- Period vs. period
- Month vs. month
- Vs. other stations: Select one or more stations to compare with.
- All stations average
The report contains the detailed sales data grouped by selected fuel types or grades configured on your account in the UST section. For example, the report may contain the detailed sales data for the Regular, Plus, Super, and Ultra fuel types.
For more information on how to configure fuel types, see Mix & Fuels Settings.
To generate the report in the Filters > Report Type, select the filter you need and click Refresh.
This report provides a comprehensive breakdown of sales performance categorized by fuel type:
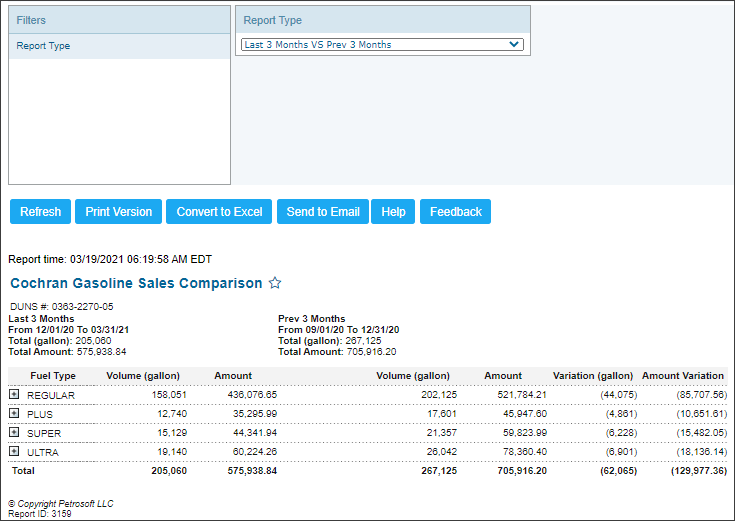
- Fuel Type: Identifies the specific category of fuel sold (Regular, Premium, and so on).
- A comparative analysis of sales performance. When the Vs. Other Stations filter is active, the data is dynamically grouped by station, allowing for side-by-side benchmarking of different locations.
- Volume (gallons): The total quantity of fuel sold during the selected period.
- Sold amount: The gross monetary value generated from fuel sales.
- Variation (gallon): The absolute difference in volume between the current reporting period and the comparison baseline.
- Amount Variation: The monetary difference in sales value compared to the baseline.
Additional Actions
To display more detailed sales comparison data by months, click the corresponding fuel type's name.
To display more detailed sales comparison data by days, double-click the corresponding fuel type's name.
For more information on additional report features, see Reports.
Filtering the Report Data
To get the exact information you need, you can apply filters to the report. To set up a filter, select one or more filtering options. Once the filter is set up, at the bottom of the filter section, click the Refresh button to display the report data by the filter criteria.
- Select a station to be included in the report.
- Select the report type.


