This section describes the specifics of accessing and interpreting the Fuel Prices Change History report.
Please note that the report is supported only by the Verifone Ruby and Wayne cash registers.
Opening the Report
You can find the report at Reports > Fuel > Sales > Fuel Prices Change History. For more information, see Viewing Reports.
Viewing the Report
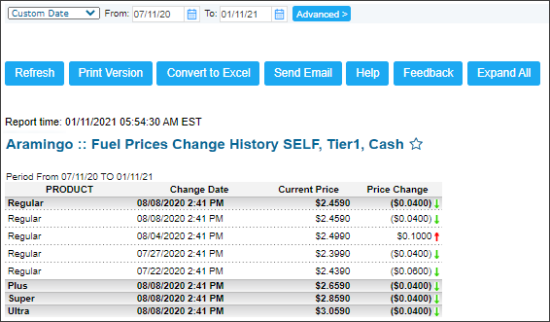
The Fuel Prices Change History report provides the information about change in prices for all fuel types within the specified period.
If the prices of a certain fuel type have not been changed within the specified period of time, this fuel type is not displayed in the report.
The report displays the following information:
- The Fuel Prices Change History table with the following data:
- Product: The fuel type.
- Change Date: The last change date. To view all change dates within the specified period, click the date to expand it.
- Current Price: The fuel price for a certain date that is displayed in the Change Date column.
- Price Change: The difference in the previous and current price value.
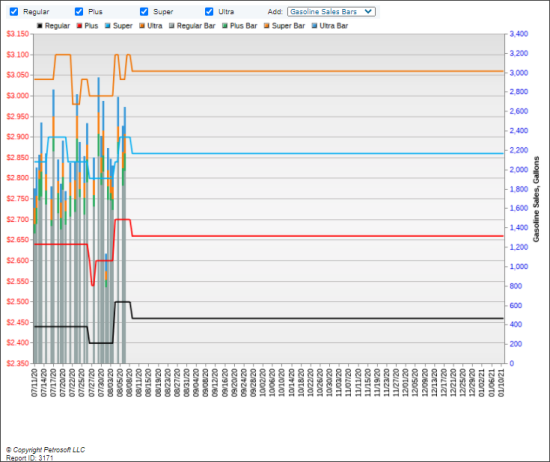
- The Fuel Price Change History diagram
Filtering and Sorting the Report Data
To get the exact information you need, you can apply filters to the report. To set up a filter, select one or more filtering options. Once the filter is set up, at the bottom of the filter section, click the Refresh button to display the report data by the filter criteria.
You can specify the period you are interested in manually using the calendar or use one of the available filtering options, and then click Refresh There are the following filtering periods available:
- Custom Date
- Yesterday
- Current Month
- Current Quarter
- Current Year
- Last Month
- Last Quarter
- Last Year
- Last 12 months
In addition to the time interval filter, you can filter the report data by specific parameters:
- Click Advanced.
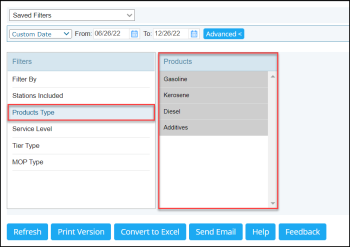
- In the Filters section, select the required option.
- Filter By: Use this option to filter the report data by tags assigned to stations (locations). The generated report will contain data only for those stations to which the selected tags are assigned.
- Stations Included: Select the stations (locations) you want to view the report for.
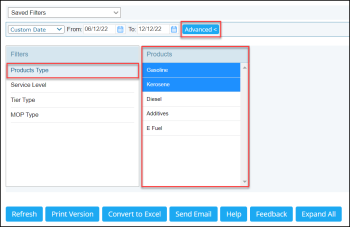
- Products Type: Select the fuel type you want to be displayed in the report. Press CTRL, to select several items at a time.
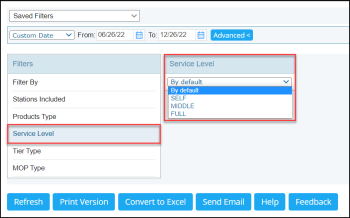
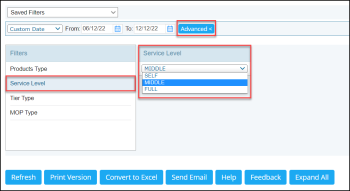
- Service Level: Select the service level for the report.
- By default - data as configured in the CR mapping settings (see Data Entry > Dashboard > Station Options > UST System > CR Mapping and the image below)
- Self - data filtered by the service type where the customers operate the fuel pump themselves
- Middle - data filtered by the service type where an attendant operates the fuel pump
- Full - data filtered by the service type where an attendant operates the fuel pump and provides additional services like windshield cleaning or oil level check
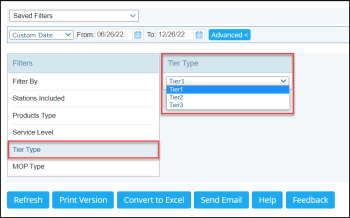
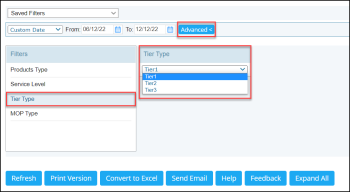
- Tier Type: Select the required tier for fuel prices depending on the weekday and time of the day. By default, the Tier1 type is selected and applied to the report.
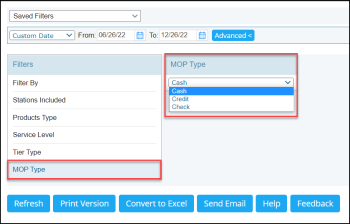
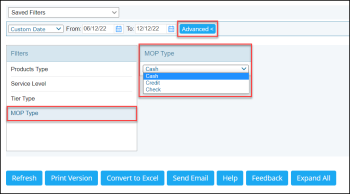
- MOP Type: Select the mode of payment. By default, the Cash option is selected and applied to the report.
- Click Refresh to apply filters to the report.
- Click Advanced.
- In the Filters section, select the required option.
- Products Type: Select the fuel type you want to be displayed in the report. Press CTRL, to select several items at a time.
- Service Level: Select the service level for the report - Self (customers operate the fuel pump themselves), Middle (an attendant operates the fuel pump), or Full (an attendant operates the fuel pump and provides additional services like windshield cleaning or oil level check).
By default, the option configured in the CR mapping settings is applied (Data Entry > Dashboard > Station Options > UST System > CR Mapping)
- Tier Type: Select the required tier for fuel prices depending on the weekday and time of the day.
By default, the Tier1 type is selected and applied to the report.
- MOP Type: Select the mode of payment.
By default, the Cash option is selected and applied to the report.
- Click Refresh to apply filters to the report.
Additional Actions
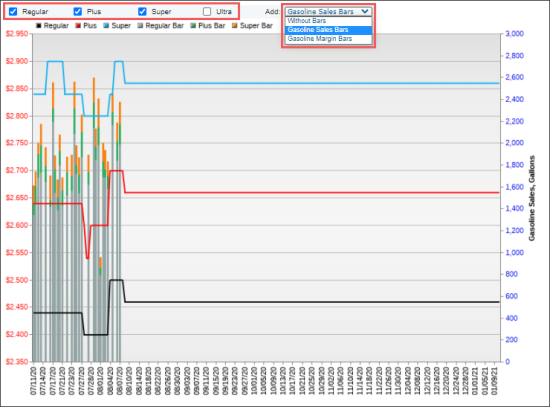
- To display in the Fuel Prices Change History diagram all fuel product types, select them in the corresponding options above the diagram.
- To add or remove additional bars to the Fuel Prices Change History diagram, select the corresponding options:
- Without Bars
- Gasoline Sales Bars
- Gasoline Margin Bars
For more information on additional report features, see Reports.
