


The Key Performance Indicators step gives you projections on sales and possible fuel purchases.
KPI, or Key Performance Indicators, is a Projection Report based on what CStoreOffice® thinks you will do based on sales trends. To see the comparison, you must be using CStoreOffice® for a year. This is a great tool for managers to use to help increase profit.
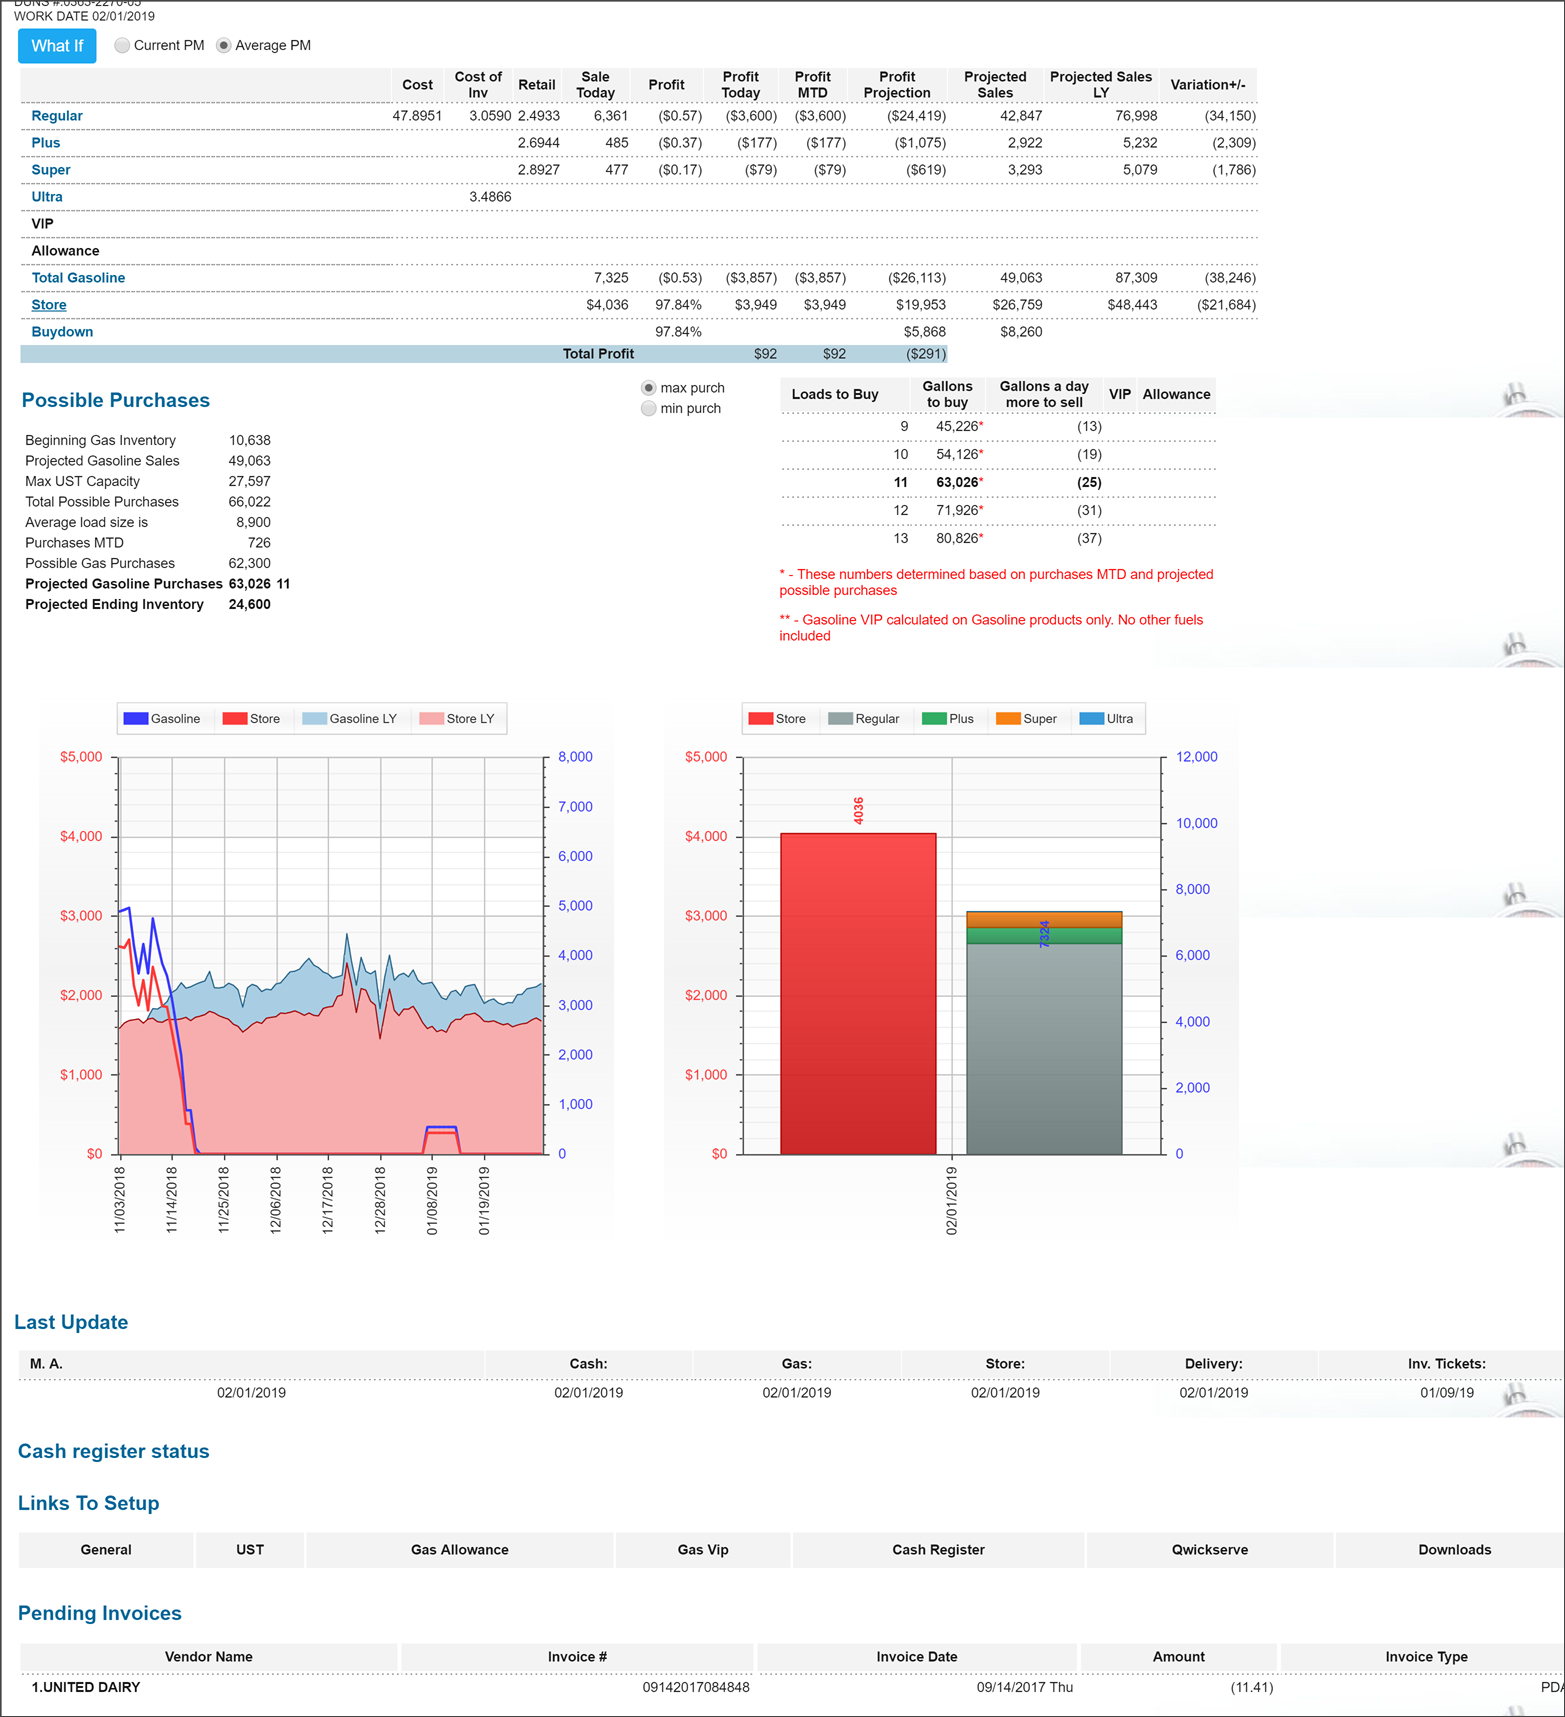
- The first section is dedicated to fuel purchases and sales broken down by grade. You can see the cost, retail cost for the last 30 days and projections for profit as well as sales based on LY’s data and the variation in the last column.
- At the bottom right corner of the report, you can see projections on how much gas to purchase based on purchases MTD and projected possible purchases.
- The graph on the left illustrates gasoline by volume and store sales comparing information over a three-month period. The dollar values are on the left and the gasoline volume is on the right.
At the top, you can see the legend and the colors represented:
- The dark blue is gasoline for this year as well as your store sales in red for this year, represented by a line only.
- Last year sales for the store is in pink and hidden behind is your Gasoline for LY.
- The graph on the right illustrates store sales in red, with the dollar values on the left and gasoline values by volume in blue on the right.
Each grade of gas has its own color for representation purposes. The dates below are for a one-week period running from Tuesday to Tuesday on the chart.


