


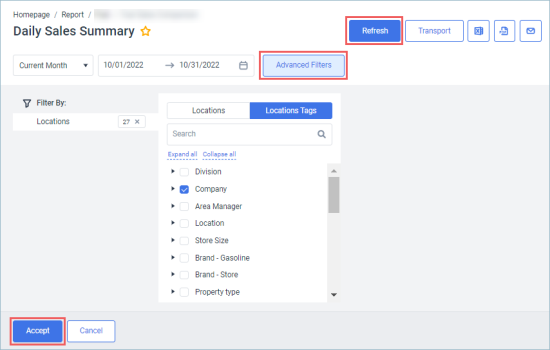
To get the exact information you need, you can apply filters to the report. To set up the report filters:
- Click Advanced Filters.
- Select one or more filtering options.
- At the bottom of the filtering options form, click Accept.
- At the top right of the report form, click Refresh.

The report provides the following filtering options:
- Date: Specify the period you are interested in manually using the calendar or use one of the available filtering options, and then click Refresh. There are the following filtering periods available:
- Custom Date: Use this filter, if you need to define the period manually.
- Yesterday
- Current Month
- Current Quarter
- Current Year
- Last Month
- Last Quarter
- Last Year
- Last 12 Month
- YTD Comparison: Year to date period, starting from the beginning of the year and continuing up to the day selected in the calendar.
- Filter by Locations: Select the stations (locations) you want to view the report for.
- Filter by Location Tags: Use this option to filter the report data by tags assigned to stations (locations). The generated report will contain data only for those stations to which the selected tags are assigned.
To select tags by which the report data must be filtered, expand the tags tree and select the check boxes next to the necessary tags. You can filter the report data by root tags and tags of the lower level in the tags hierarchy. You can also create a combined filter by selecting different root and child tags.
The period applied to the report data is displayed in bold in the list.
Subtotals
If you want to break down the report by the specific criteria, use the Subtotal option.
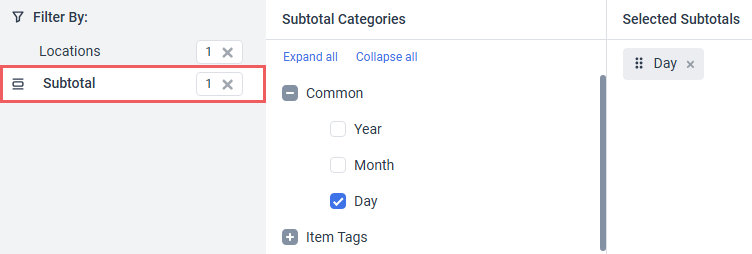
Select the filtering option from Subtotal Categories:
- Common
- Year - group report data by years.
- Month - group report data by months.
- Day - group report data by days.
- Item tags - group report data by item tags.


